. 2018 Mar 29;19(1):46.
doi: 10.1186/s13059-018-1418-0.

Full-length mRNA sequencing uncovers a widespread coupling between transcription initiation and mRNA processing

Affiliations

Full-length mRNA sequencing uncovers a widespread coupling between transcription initiation and mRNA processing

Seyed Yahya Anvar et al. Genome Biol. .

Abstract

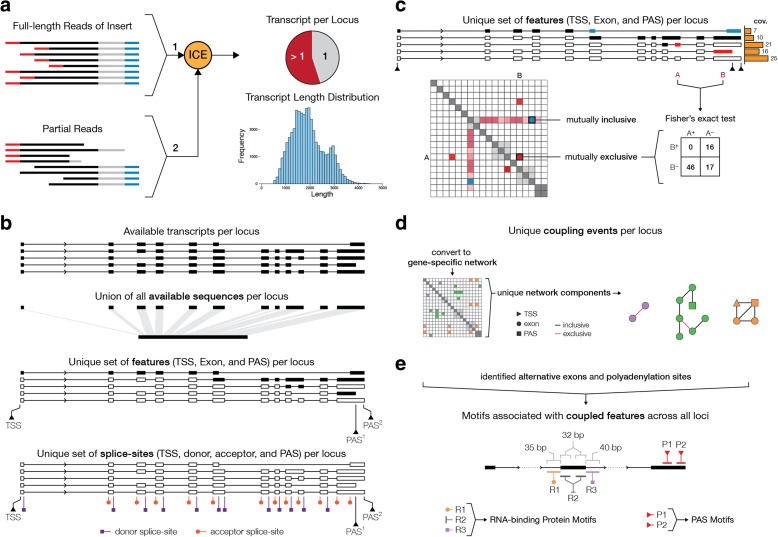
Background: The multifaceted control of gene expression requires tight coordination of regulatory mechanisms at transcriptional and post-transcriptional level. Here, we studied the interdependence of transcription initiation, splicing and polyadenylation events on single mRNA molecules by full-length mRNA sequencing.

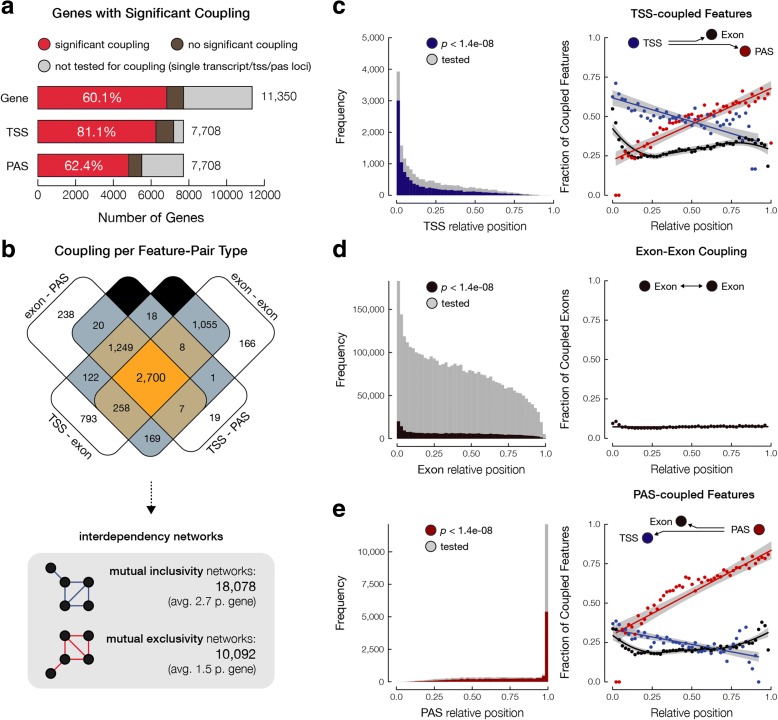
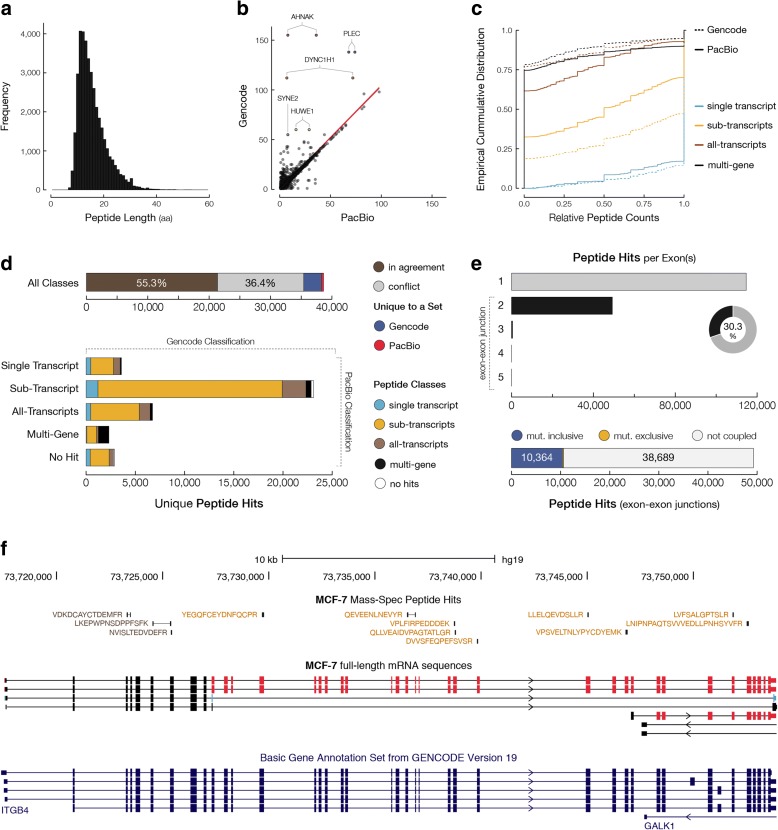
Results: In MCF-7 breast cancer cells, we find 2700 genes with interdependent alternative transcription initiation, splicing and polyadenylation events, both in proximal and distant parts of mRNA molecules, including examples of coupling between transcription start sites and polyadenylation sites. The analysis of three human primary tissues (brain, heart and liver) reveals similar patterns of interdependency between transcription initiation and mRNA processing events. We predict thousands of novel open reading frames from full-length mRNA sequences and obtained evidence for their translation by shotgun proteomics. The mapping database rescues 358 previously unassigned peptides and improves the assignment of others. By recognizing sample-specific amino-acid changes and novel splicing patterns, full-length mRNA sequencing improves proteogenomics analysis of MCF-7 cells.

Conclusions: Our findings demonstrate that our understanding of transcriptome complexity is far from complete and provides a basis to reveal largely unresolved mechanisms that coordinate transcription initiation and mRNA processing.


Conflict of interest statement

Ethics approval and consent to participate

No ethical approval was needed to perform this study.

Competing interests

ET and SWT are full-time employees of Pacific Biosciences. RHY and HEJ are full-time employees of LGC Biosearch Technologies. All other authors declare that they have no competing interests.

Review history

This article is part of our transparent review trial, and as such the review history is available as Additional file 2.

Publisher’s Note

Springer Nature remains neutral with regard to jurisdictional claims in published maps and institutional affiliations.

Figures

Fig. 1
Fig. 1
Schematic overview of the approach to characterize the interdependencies between mRNA transcription initiation and processing events. a Identified full-length reads (reads with RNA inserts between 5′ and 3′ primers) are clustered into unique transcript structures using the ICE algorithm and further polished using the partial reads, where one of the primer sequences is missing. b Based on available transcripts per locus, available sequence (union of all exonic sequences that are observed at each locus) and unique set of features and splice sites are identified. Feature sets comprise unique transcriptional start sites (TSS), exons, and polyadenylation sites (PAS). The unique set of splice sites consists of unique donor and acceptor splice sites as well as all alternative TSSs and PASs. c The survey of coupling events is done by performing all possible pairwise tests between unique features in genes. The sum of the coverage of all transcripts that support the inclusion or exclusion of each pair is used in a contingency table to perform a Fisher’s exact test for statistical significance. The odds ratio (OR) is used to differentiate between mutually inclusive and exclusive coupling. d Set of interdependent coupling events were identified based on networks of coupling between features in each gene. Nodes represent features and links depict the mutual inclusivity (black edges) or mutual exclusivity (red edges) of each feature pair. Unique network components can thereby be filtered based on the type of interaction: mutual inclusive or mutual exclusive coupling events. e For all alternative exons that show significant coupling, a motif search is performed to assess the enrichment of specific RNA-binding protein motifs. For all alternative exons, 35-bp intronic sequences upstream of the acceptor site are defined as R1 domain (depicted in orange), 32-bp exonic sequences downstream of the acceptor site and upstream of the donor site are defined as R2 domain (depicted in dark gray), and 40-bp intronic sequences downstream of the donor site are defined as R3 domain (depicted in purple); 35-bp sequence upstream of each PAS (depicted in red) is searched for the presence of canonical and non-canonical poly(A) signals
Fig. 2
Fig. 2
Alternative transcription, splicing, and polyadenylation are highly interdependent. a Bar charts illustrate the number and proportion of genes that show significant coupling in MCF-7 cells. Genes with TSS- or PAS-coupled features are also presented. b Venn diagram shows the number of genes with various types of coupling representing interdependencies between different alternative processes. The total number of mutually inclusive and exclusive networks are also listed. c Histogram of the relative positions of TSSs with (blue) and without (gray) significant coupling to mRNA processing events. Relative positions are calculated based on the length of the total exonic sequence at each locus. Scatter plot shows the fraction of significantly coupled TSSs (blue) to alternative exons (black) and PASs (red), plotted at each relative position. d Histogram of the relative positions of alternative exons with (brown) and without (gray) significant coupling to other exons. Scatter plot shows the fraction of significantly coupled exons to other exons, plotted at each relative position. e Histogram of the relative positions of PASs with (red) and without (gray) significant coupling to alternative transcription and splicing events. Scatter plot shows the fraction of significantly coupled PASs (red) to alternative TSSs (blue) and exons (black), plotted at each relative position. For plots depicting the percentage of linked features per position, the bin size of 0.02 was used
Fig. 3
Fig. 3
Alternative TSSs and exons are significantly associated with known and novel poly(A) signals. a Bar charts show the number and relative proportion of PASs that are associated with canonical or non-canonical poly(A) signals for all PASs, PASs with significant coupling, and alternative exon- and/or TSS-linked PASs. b Bar charts represent the number and relative proportion of known and unknown poly(A) signals for TSS-linked, exon-linked, or TSS- and exon-linked PASs
Fig. 4
Fig. 4
Comprehensive map of protein peptides supports novel alternative splicing events in full-length MCF-7 transcriptome. a Histogram shows the distribution of peptide amino acid (aa) lengths that could be associated with either Gencode or PacBio transcript variants. b Scatter plot illustrates the number of unique peptide hits per gene based on PacBio (x-axis) or Gencode annotation (y-axis). Each dot represents a single gene locus based on matching of PacBio and Gencode genes. c Empirical cumulative distribution of relative peptide counts per gene for each peptide hit category. Genes with a single transcript annotation (single-transcript category) are shown in light blue. Multi-transcript genes with peptides matching to a subset of transcripts (sub-transcripts category) are shown in yellow. Multi-transcript genes with peptides matching to all annotated transcripts (all-transcripts category) are shown in brown. Multi-gene hits are shown in black. Dotted lines represent the cumulative distributions based on the Gencode annotation. d Bar charts illustrate the comparison of Gencode- or PacBio-based classification of Peptides. e Bar charts show the number of peptides derived from exon–exon junctions of transcripts. The number of peptides that match exon–exon junction of mutually inclusive (blue) or exclusive (yellow) exons. f Peptides with different classification matching to multiple transcripts of ITGB4. Black peptides are all-transcripts hits whereas, based on full-length MCF-7 transcriptome data, yellow peptides are only associated with a subset of transcripts. Exons are colored based on coupling networks, shown in red and blue

References

    1. Pan Q, Shai O, Lee LJ, Frey BJ, Blencowe BJ. Deep surveying of alternative splicing complexity in the human transcriptome by high-throughput sequencing. Nat Genet. 2008;40:1413–1415. doi: 10.1038/ng.259. - DOI - PubMed
    1. Barash Y, Calarco JA, Gao W, Pan Q, Wang X, Shai O, et al. Deciphering the splicing code. Nature. 2010;465:53–59. doi: 10.1038/nature09000. - DOI - PubMed
    1. Wang ET, Sandberg R, Luo S, Khrebtukova I, Zhang L, Mayr C, et al. Alternative isoform regulation in human tissue transcriptomes. Nature. 2008;456:470–476. doi: 10.1038/nature07509. - DOI - PMC - PubMed
    1. Auboeuf D, Dowhan DH, Dutertre M, Martin N, Berget SM, O’Malley BW. A subset of nuclear receptor coregulators act as coupling proteins during synthesis and maturation of RNA transcripts. Mol Cell Biol. 2005;25:5307–5316. doi: 10.1128/MCB.25.13.5307-5316.2005. - DOI - PMC - PubMed
    1. Bentley DL. Coupling mRNA processing with transcription in time and space. Nat Rev Genet. 2014;15:163–175. doi: 10.1038/nrg3662. - DOI - PMC - PubMed

Publication types

LinkOut - more resources