. 2018 Mar 29;16(1):36.
doi: 10.1186/s12915-018-0496-5.

Combined flow cytometry and high-throughput image analysis for the study of essential genes in Caenorhabditis elegans

Affiliations

Combined flow cytometry and high-throughput image analysis for the study of essential genes in Caenorhabditis elegans

Blanca Hernando-Rodríguez et al. BMC Biol. .

Abstract

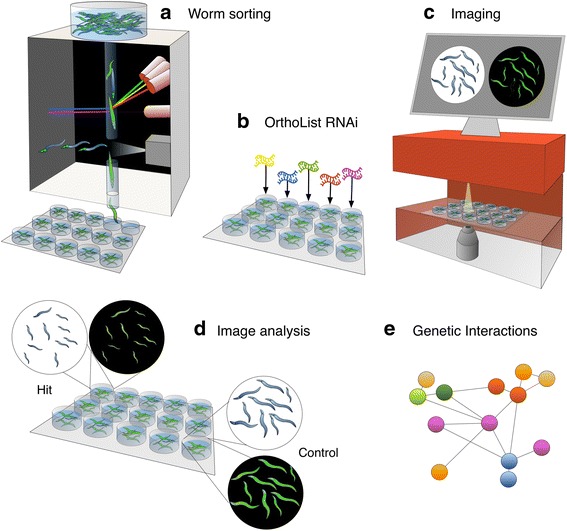
Background: Advances in automated image-based microscopy platforms coupled with high-throughput liquid workflows have facilitated the design of large-scale screens utilising multicellular model organisms such as Caenorhabditis elegans to identify genetic interactions, therapeutic drugs or disease modifiers. However, the analysis of essential genes has lagged behind because lethal or sterile mutations pose a bottleneck for high-throughput approaches, and a systematic way to analyse genetic interactions of essential genes in multicellular organisms has been lacking.

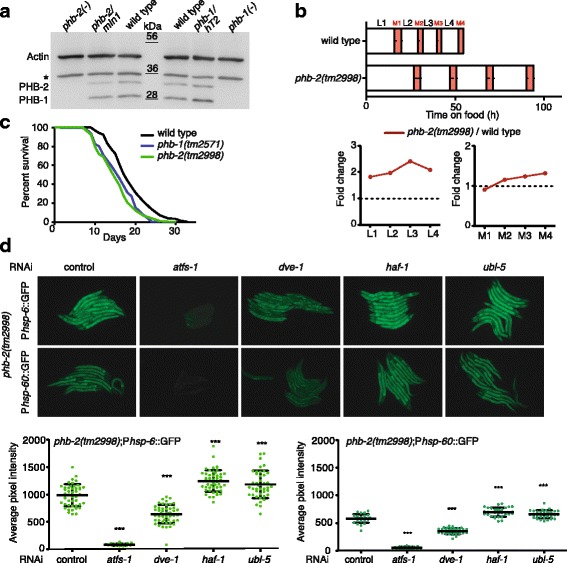
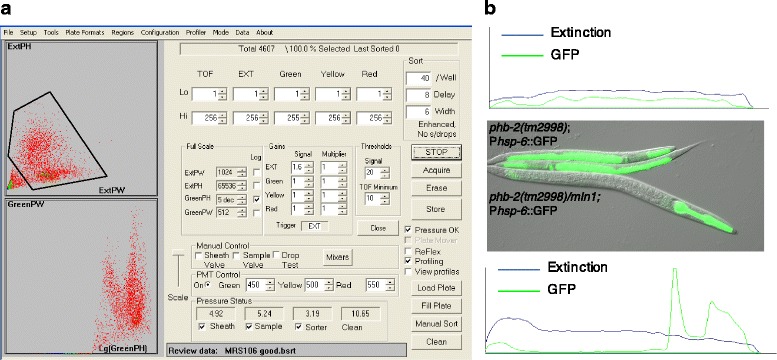
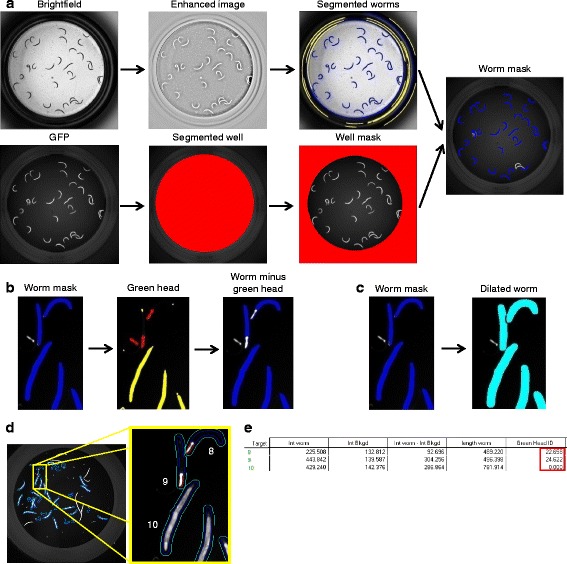
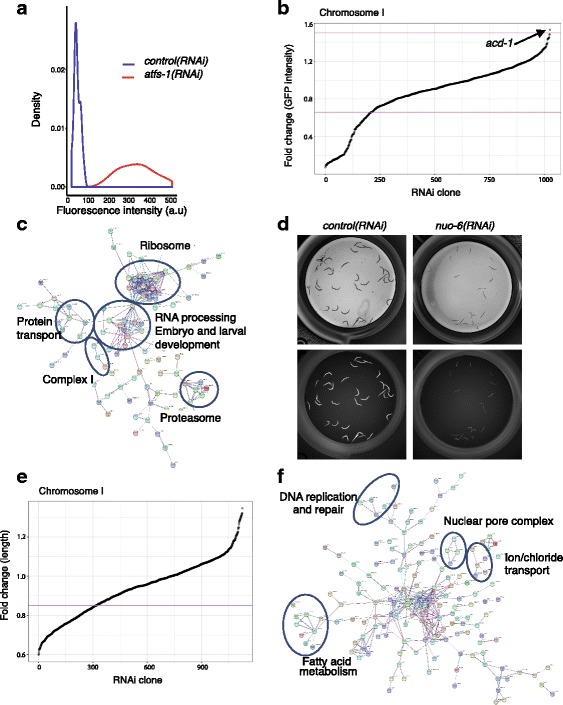
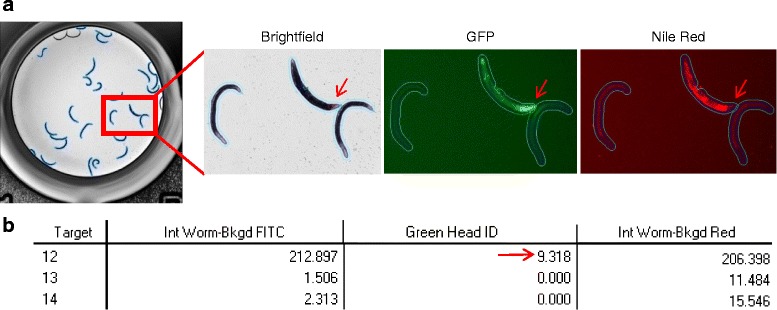
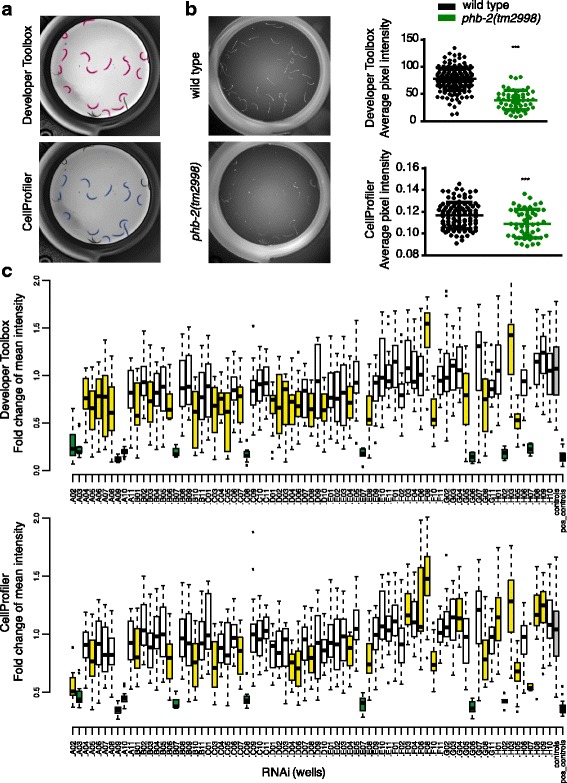
Results: In C. elegans, non-conditional lethal mutations can be maintained in heterozygosity using chromosome balancers, commonly expressing green fluorescent protein (GFP) in the pharynx. However, gene expression or function is typically monitored by the use of fluorescent reporters marked with the same fluorophore, presenting a challenge to sort worm populations of interest, particularly at early larval stages. Here, we develop a sorting strategy capable of selecting homozygous mutants carrying a GFP stress reporter from GFP-balanced animals at the second larval stage. Because sorting is not completely error-free, we develop an automated high-throughput image analysis protocol that identifies and discards animals carrying the chromosome balancer. We demonstrate the experimental usefulness of combining sorting of homozygous lethal mutants and automated image analysis in a functional genomic RNA interference (RNAi) screen for genes that genetically interact with mitochondrial prohibitin (PHB). Lack of PHB results in embryonic lethality, while homozygous PHB deletion mutants develop into sterile adults due to maternal contribution and strongly induce the mitochondrial unfolded protein response (UPRmt). In a chromosome-wide RNAi screen for C. elegans genes having human orthologues, we uncover both known and new PHB genetic interactors affecting the UPRmt and growth.

Conclusions: The method presented here allows the study of balanced lethal mutations in a high-throughput manner. It can be easily adapted depending on the user's requirements and should serve as a useful resource for the C. elegans community for probing new biological aspects of essential nematode genes as well as the generation of more comprehensive genetic networks.

Keywords: C. elegans; Essential genes; High-content; High-throughput; Image analysis; Mitochondria; Prohibitins; Screens; UPRmt; Worm sorting.


Conflict of interest statement

Ethics approval and consent to participate

Not applicable.

Consent for publication

Not applicable.

Competing interests

The authors declare that they have no competing interests.

Publisher’s Note

Springer Nature remains neutral with regard to jurisdictional claims in published maps and institutional affiliations.

Figures

Fig. 1
Fig. 1
Characterisation of phb-2(tm2998) mutants. a Western blot showing PHB protein levels. In homozygous phb-1(tm2571) and phb-2(tm2998) mutants, both proteins, PHB-1 and PHB-2, are undetectable. Actin is used as loading control. Asterisk denotes unspecific band. One representative western out of three is shown. b Average duration of development for wild-type (n = 12) and phb-2(tm2998) mutants (n = 18) at 20 °C, using the LUC::GFP bioluminescent reporter. Red represents the molts as inferred by low LUC signal. Error bars represent the standard deviation (SD) of the duration of each interval. The graphs below represent the duration of larval stages (L1–L4) and molts (M1–M4) normalised to wild type. The duration of all larval stages (L1–L4) is significantly different between wild type and phb-2(tm2998) mutants (P value < 0.001; two-tailed unpaired t test). The duration of the M2–M4 molting cycles is significantly different amongst wild type and phb-2(tm2998) mutants, with the exception of M1 (P value < 0.001; two-tailed unpaired t test). A representative experiment of two independent replicas is shown. c Lifespans of phb-1(tm2571) (mean = 17±1 days, n = 215) and phb-2(tm2998) (mean = 14.5±0.5 days, n = 302) are significantly shorter than that of the wild type (mean = 18 days, n = 137) (P value < 0.0001, log-rank (Mantel-Cox)). Average of two independent assays is shown. d Background-dependent induction of UPRmt reporters in prohibitin deletion mutants. Fluorescent microscopy images of transgenic animals phb-2(tm2998);Phsp-6::GFP and phb-2(tm2998);Phsp-60::GFP treated with RNAi against the UPRmt components ATFS-1, DVE-1, HAF-1 and UBL-5. Graphical representation of quantification of Phsp-6::GFP (bottom panel, left) and Phsp-60::GFP (bottom panel, right). The induced UPRmt in prohibitin deletion mutants is suppressed upon depletion of atfs-1 and dve-1, whereas the expression of both UPRmt reporters is further increased upon depletion of haf-1 and ubl-5. n > 30 in all conditions. (Mean ± SD; ***P value < 0.001; analysis of variance (ANOVA) test.) One independent replicate out of three is shown
Fig. 2
Fig. 2
Overview of the screening strategy for the study of essential genes. a Homozygous phb-2(tm2998);Phsp6::GFP mutants are sorted at L2 stage from a mixed population of balanced heterozygous phb-2(tm2998)/mIn1 animals into multiwell plates using the COPAS Biosort “worm sorting”. b Next, bacteria containing the OrthoList RNAi sublibrary are added to the wells and worms are incubated at 20 °C. c When worms reach the desired stage, they are imaged in brightfield and fluorescent channels using an automated microscope, IN Cell Analyzer (GE Healthcare). d Employing a user-defined image segmentation protocol, hits can be defined based on different measurements like reporter expression or size of the worms in comparison with the control. e Finally, hits can be analysed by building genetic networks based on predicted and described protein interactions in different organisms
Fig. 3
Fig. 3
Worm sorting settings based on gating region and Profiler feature. a COPAS Biosort conditions optimised for the sorting of homozygous phb-2(tm2998);Phsp-6::GFP at the L2 stage. The upper panel reflects the gating region based on the extinction peak height (ExtPH) and the extinction peak width (ExtPW) selecting the worm population. The lower panel shows the worm distribution based on green parameters (green peak height (green PH) and green peak width (green PW)). b Utilising the Profiler II software to distinguish between phb-2(tm2998)/mIn1;Phsp-6::GFP and phb-2(tm2998);Phsp-6::GFP larvae using green parameters. The phb-2(tm2998)/mIn1;Phsp-6::GFP worms show two peaks in the green profile corresponding to the two lobes of the pharynx, have a green PH above 10,000 and are excluded (bottom panel). The phb-2(tm2998);Phsp-6::GFP larvae show a profile without pronounced peaks, with a green PH ranging from 700 to 10,000 and green PW above 120, and are accepted and sorted (top panel). The picture includes a balanced heterozygous phb-2(tm2998)/mIn1;Phsp-6::GFP expressing Pmyo-2::GFP in the pharynx and two phb-2(tm2998);Phsp-6::GFP homozygous deletion mutants with induced Phsp-6::GFP expression imaged at the moment of sorting, approximately 48 h after synchronisation
Fig. 4
Fig. 4
Outline of the GFP image segmentation protocol for balanced mutants. a Representative images acquired in brightfield and green channels. First, the well is segmented based on intensity in the green channel, then the image is inverted (bottom). The brightfield image is subjected to pre-processing to enhance the contrast for ease of segmentation. The segmented worms are tagged in blue and excluded objects are tagged in yellow (top). Exclusion criteria are specified in Additional file 4. The user can modulate these morphological parameters per requirement. By subtracting the well mask from the segmented worms, we obtain the worm mask. b Identification of heterozygous animals (Green head ID). Once worm mask is defined, green heads are segmented and tagged in red, excluded objects are tagged in yellow. Exclusion is based on area and intensity levels. The user can modulate these morphological parameters per requirement. The next step subtracts the identified green heads from the worm bodies. As a result, segmented worms appear blue without the green heads (Worm minus green head). c Background subtraction. Segmented worms are dilated in order to facilitate measurement of the intensity of the immediate background. d Target linking in order to compose one final target. Worm mask, dilated worm and worm minus green head targets are linked together. The final target shows the three measurement regions: the worms in blue, the immediate background in cyan and the green head in red. e Identified targets with the corresponding measurements. Intensity of the worm (Int worm), intensity of the immediate background (Int Bkgd), background subtraction (Int worm - Int Bkgd), worm length and identification of green head (Green Head ID). Targets 8 and 9 correspond to heterozygous worms with a green head ID greater than 0. Additional measures like area, major axis length, X/Y position and form factor can be added per user requirement
Fig. 5
Fig. 5
Analysis of the screening data. a Density plot (frequency distribution) of the negative controls (control(RNAi)) and positive controls (atfs-1(RNAi)) based on the GFP intensities. b Fold change (FC) of GFP intensity of the 1207 tested RNAi clones against the ordered index. Genes with a P value < 0.001 and FC < 0.66 or FC > 1.5 are considered as candidates. Depletion of 208 RNAi clones downregulates Phsp-6::GFP signal, whereas only one candidate triggers a further induction of the reporter. c Interaction network of the 208 genes whose depletion reduces the UPRmt. Networks are built using STRING [76], based on predicted and described interactions in different organisms. Nodes are proteins, and the edges represent the associations between nodes. Clusters show genes involved in processes previously described to be involved in the regulation of the mitochondrial stress response such as ribosome, proteasome, RNA processing, protein transport and complex I of the mitochondrial electron transport chain. d Brightfield and green images of control(RNAi) and nuo-6(RNAi). Depletion of nuo-6 triggers a developmental delay in addition to the reduction in the UPRmt reporter expression. e FC of worm length of the 1207 tested RNAi clones against the ordered index. Genes with an FC < 0.85 are considered as clones affecting development. Depletion of 303 genes reduces size of the worms. f Interaction network of the 303 genes whose depletion reduces size of the worms. Networks are built using STRING [76], based on predicted and described interactions in different organisms. Nodes are proteins; edges represent the associations between nodes. Clusters show genes involved in DNA replication and repair, fatty acid metabolism, ion channels and nuclear pore complex
Fig. 6
Fig. 6
Combined green/red image analysis protocol. a Images acquired in brightfield, green (GFP) and red (Nile Red) channels with the IN Cell Analyzer 2000 and processed using Developer Toolbox software (GE Healthcare). A balanced heterozygous animal expressing pharyngeal GFP has been identified (red arrow) within a population of homozygous phb-2(tm2998) mutants. The heterozygous animal exhibits increased Nile Red staining in comparison to the homozygous phb-2(tm2998) mutants. b Segmentation analysis output of the green/red image analysis for balanced mutants. Worm intensity subtracting the background intensity in the green image (Int Worm-Bkgd FITC), identification of green head (Green Head ID) and worm intensity subtracting the background intensity in the red image (Int Worm-Bkgd Red) are depicted in the analysis output. Target 12, with a green head ID greater than 0, corresponds to the heterozygous worm. Additional measures like area, major axis length, X/Y position and form factor can be added per user requirement
Fig. 7
Fig. 7
Open source segmentation protocol (CellProfiler). a Comparison of the image segmentation output for phb-2(tm2998) mutants generated from Developer Toolbox (GE Healthcare) versus CellProfiler. b Nile Red staining of phb-2(tm2998) mutants versus wild-type animals. Representative images taken with the IN Cell Analyzer and graphical representation of data coming from the different segmentation protocols. As previously shown [47], depletion of phb-2 reduces Nile Red staining using both of the protocols. (Mean±SD; ***P value < 0.0001 (Developer Toolbox) and ***P value = 0.0008 (CellProfiler); two-tailed unpaired t test; n > 45 for both conditions, combination of 3–5 different wells.) c Comparison of the UPRmt reporter signal after image analysis from Developer Toolbox (GE Heathcare) versus CellProfiler. The box plots represent fold change (FC) mean intensities of the RNAi clones from a randomly chosen 96-well plate from the UPRmt RNAi screen. RNAi clones with a P value < 0.001 appear in yellow and candidates with a P value < 0.001 and an FC < 0.5 appear in dark green. Control wells (control RNAi) appear in grey and positive control (atfs-1(RNAi)) in black. By comparing both box plots, we see that results from the different segmentation protocol are highly similar

Similar articles

Cited by

References

    1. Dickerson JE, Zhu A, Robertson DL, Hentges KE. Defining the role of essential genes in human disease. PLoS One. 2011;6(11):e27368. doi: 10.1371/journal.pone.0027368. - DOI - PMC - PubMed
    1. Costanzo M, VanderSluis B, Koch EN, Baryshnikova A, Pons C, Tan G, Wang W, Usaj M, Hanchard J, Lee SD, et al. A global genetic interaction network maps a wiring diagram of cellular function. Science. 2016;353:6306. doi: 10.1126/science.aaf1420. - DOI - PMC - PubMed
    1. Kemphues K. Essential genes. WormBook. 2005:1–7. - PMC - PubMed
    1. Ramani AK, Chuluunbaatar T, Verster AJ, Na H, Vu V, Pelte N, Wannissorn N, Jiao A, Fraser AG. The majority of animal genes are required for wild-type fitness. Cell. 2012;148(4):792–802. doi: 10.1016/j.cell.2012.01.019. - DOI - PubMed
    1. Housden BE, Muhar M, Gemberling M, Gersbach CA, Stainier DY, Seydoux G, Mohr SE, Zuber J, Perrimon N. Loss-of-function genetic tools for animal models: cross-species and cross-platform differences. Nat Rev Genet. 2017;18(1):24–40. doi: 10.1038/nrg.2016.118. - DOI - PMC - PubMed

Publication types

MeSH terms