

Deficiency of Dab2 (Disabled Homolog 2) in Myeloid Cells Exacerbates Inflammation in Liver and Atherosclerotic Plaques in LDLR (Low-Density Lipoprotein Receptor)-Null Mice-Brief Report
- PMID: 29599136
- PMCID: PMC5920703
- DOI: 10.1161/ATVBAHA.117.310467
Deficiency of Dab2 (Disabled Homolog 2) in Myeloid Cells Exacerbates Inflammation in Liver and Atherosclerotic Plaques in LDLR (Low-Density Lipoprotein Receptor)-Null Mice-Brief Report
Abstract
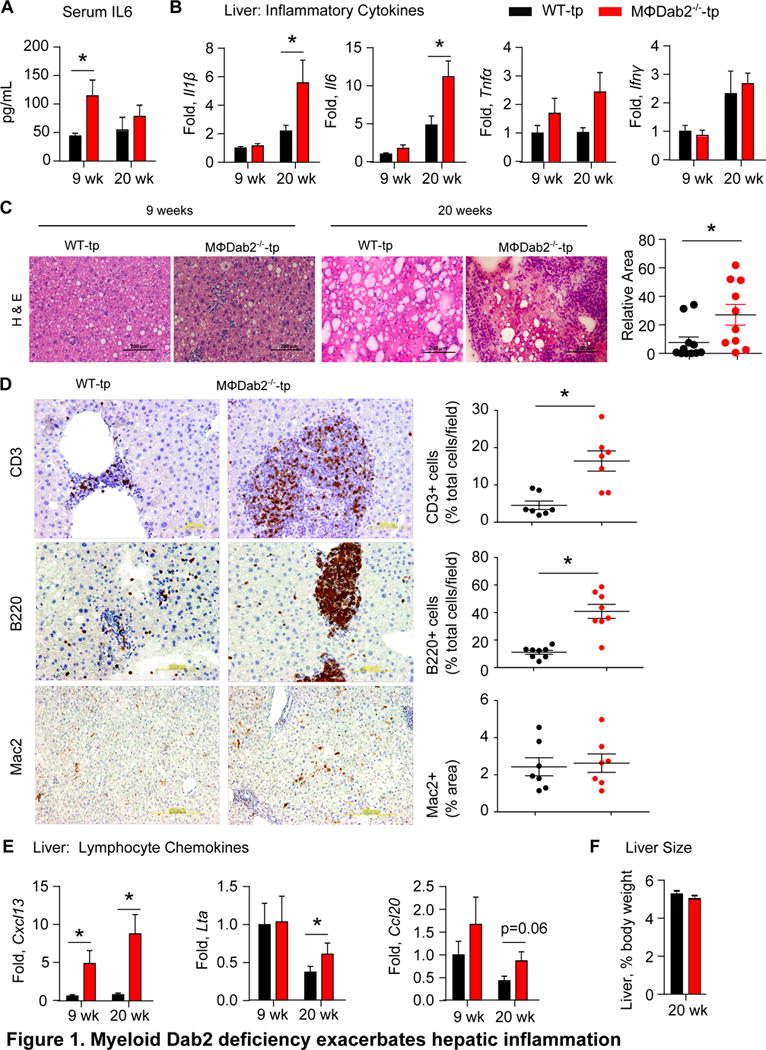
Objective: Inflammatory macrophages promote the development of atherosclerosis. We have identified the adaptor protein Dab2 (disabled homolog 2) as a regulator of phenotypic polarization in macrophages. The absence of Dab2 in myeloid cells promotes an inflammatory phenotype, but the impact of myeloid Dab2 deficiency on atherosclerosis has not been shown.
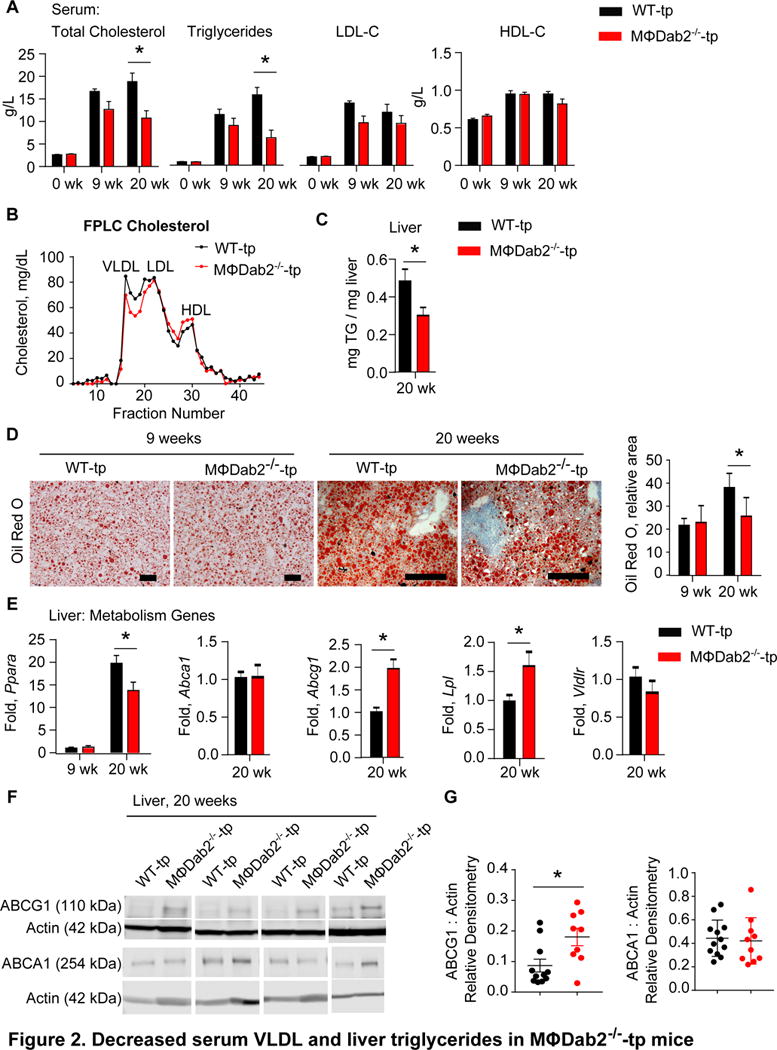
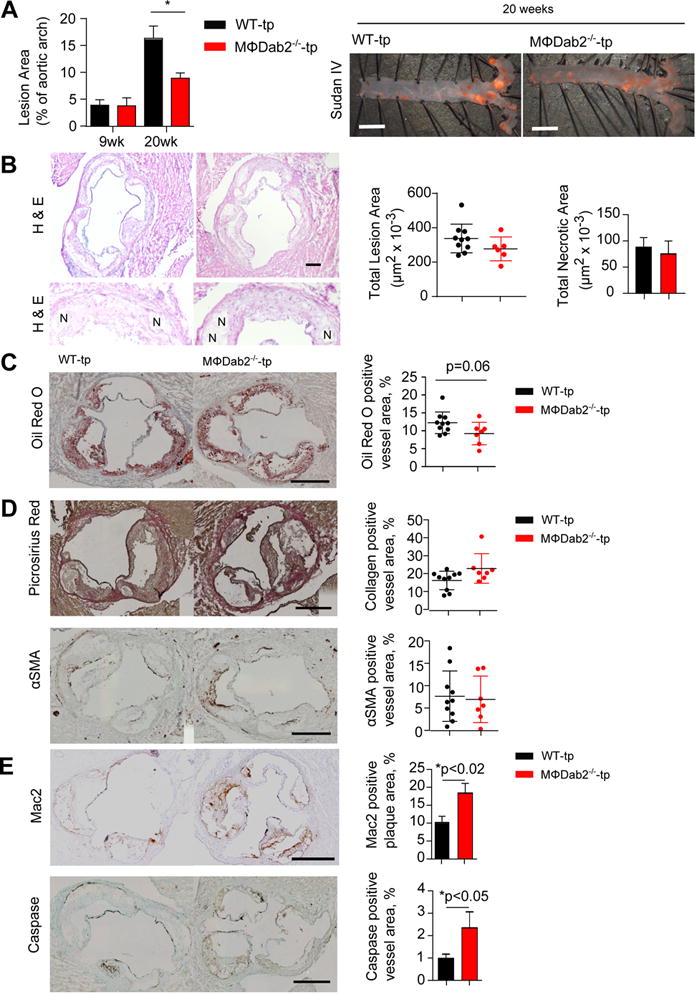
Approach and results: To determine the role of myeloid Dab2 in atherosclerosis, Ldlr-/- mice were reconstituted with either Dab2-positive or Dab2-deficient bone marrow and fed a western diet. Consistent with our previous finding that Dab2 inhibits NFκB (nuclear factor κ-light-chain-enhancer of activated B cells) signaling in macrophages, Ldlr-/- mice reconstituted with Dab2-deficient bone marrow had increased systemic inflammation as evidenced by increased serum IL-6 (interleukin-6) levels and increased inflammatory cytokine expression levels in liver. Serum lipid levels were significantly lower in Ldlr-/- mice reconstituted with Dab2-deficient bone marrow, and further examination of livers from these mice revealed drastically increased inflammatory tissue damage and massive infiltration of immune cells. Surprisingly, the atherosclerotic lesion burden in Ldlr-/- mice reconstituted with Dab2-deficient bone marrow was decreased compared with Ldlr-/- mice reconstituted with wild-type bone marrow. Further analysis of aortic root sections revealed increased macrophage content and evidence of increased apoptosis in lesions from Ldlr-/- mice reconstituted with Dab2-deficient bone marrow but no difference in collagen or α-smooth muscle actin content.
Conclusions: Dab2 deficiency in myeloid cells promotes inflammation in livers and atherosclerotic plaques in a mouse model of atherosclerosis. Nevertheless, decreased serum lipids as a result of massive inflammatory liver damage may preclude an appreciable increase in atherosclerotic lesion burden in mice reconstituted with Dab2-deficient bone marrow.
Keywords: atherosclerosis; inflammation; liver; macrophage; myeloid cell.
© 2018 American Heart Association, Inc.
Figures
Similar articles
-
Myeloid β-Catenin Deficiency Exacerbates Atherosclerosis in Low-Density Lipoprotein Receptor-Deficient Mice.Arterioscler Thromb Vasc Biol. 2018 Jul;38(7):1468-1478. doi: 10.1161/ATVBAHA.118.311059. Epub 2018 May 3. Arterioscler Thromb Vasc Biol. 2018. PMID: 29724817 Free PMC article.
-
CalDAG-GEFI Deficiency Reduces Atherosclerotic Lesion Development in Mice.Arterioscler Thromb Vasc Biol. 2016 May;36(5):792-9. doi: 10.1161/ATVBAHA.115.306347. Epub 2016 Mar 17. Arterioscler Thromb Vasc Biol. 2016. PMID: 26988592 Free PMC article.
-
Deficiency of HIF1α in Antigen-Presenting Cells Aggravates Atherosclerosis and Type 1 T-Helper Cell Responses in Mice.Arterioscler Thromb Vasc Biol. 2015 Nov;35(11):2316-25. doi: 10.1161/ATVBAHA.115.306171. Epub 2015 Sep 24. Arterioscler Thromb Vasc Biol. 2015. PMID: 26404487 Free PMC article.
-
Mouse models of atherosclerosis and their suitability for the study of myocardial infarction.Basic Res Cardiol. 2020 Nov 30;115(6):73. doi: 10.1007/s00395-020-00829-5. Basic Res Cardiol. 2020. PMID: 33258000 Free PMC article. Review.
-
Meta-Analysis of Leukocyte Diversity in Atherosclerotic Mouse Aortas.Circ Res. 2020 Jul 17;127(3):402-426. doi: 10.1161/CIRCRESAHA.120.316903. Epub 2020 Jul 16. Circ Res. 2020. PMID: 32673538 Free PMC article. Review.
Cited by
-
Updates on Approaches for Studying Atherosclerosis.Arterioscler Thromb Vasc Biol. 2019 Apr;39(4):e108-e117. doi: 10.1161/ATVBAHA.119.312001. Arterioscler Thromb Vasc Biol. 2019. PMID: 30917052 Free PMC article. No abstract available.
-
Adaptor molecules mediate negative regulation of macrophage inflammatory pathways: a closer look.Front Immunol. 2024 Feb 28;15:1355012. doi: 10.3389/fimmu.2024.1355012. eCollection 2024. Front Immunol. 2024. PMID: 38482001 Free PMC article. Review.
-
Rapid Downregulation of DAB2 by Toll-Like Receptor Activation Contributes to a Pro-Inflammatory Switch in Activated Dendritic Cells.Front Immunol. 2019 Feb 27;10:304. doi: 10.3389/fimmu.2019.00304. eCollection 2019. Front Immunol. 2019. PMID: 30873168 Free PMC article.
-
Functions of Dendritic Cells and Its Association with Intestinal Diseases.Cells. 2021 Mar 6;10(3):583. doi: 10.3390/cells10030583. Cells. 2021. PMID: 33800865 Free PMC article. Review.
-
Endocytic Adaptors in Cardiovascular Disease.Front Cell Dev Biol. 2020 Dec 11;8:624159. doi: 10.3389/fcell.2020.624159. eCollection 2020. Front Cell Dev Biol. 2020. PMID: 33363178 Free PMC article. Review.
References
-
- Mantovani A, Garlanda C, Locati M. Macrophage Diversity and Polarization in Atherosclerosis: A Question of Balance. Arterioscler Thromb Vasc Biol. 2009;29:1419–1423. - PubMed
Publication types
MeSH terms
Substances
Grants and funding
LinkOut - more resources
Full Text Sources
Other Literature Sources
Medical
Molecular Biology Databases
