

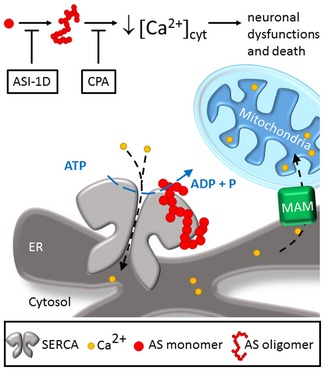
Alpha-synuclein aggregates activate calcium pump SERCA leading to calcium dysregulation
- PMID: 29599149
- PMCID: PMC5934765
- DOI: 10.15252/embr.201744617
Alpha-synuclein aggregates activate calcium pump SERCA leading to calcium dysregulation
Abstract
Aggregation of α-synuclein is a hallmark of Parkinson's disease and dementia with Lewy bodies. We here investigate the relationship between cytosolic Ca2+ and α-synuclein aggregation. Analyses of cell lines and primary culture models of α-synuclein cytopathology reveal an early phase with reduced cytosolic Ca2+ levels followed by a later Ca2+ increase. Aggregated but not monomeric α-synuclein binds to and activates SERCA in vitro, and proximity ligation assays confirm this interaction in cells. The SERCA inhibitor cyclopiazonic acid (CPA) normalises both the initial reduction and the later increase in cytosolic Ca2+ CPA protects the cells against α-synuclein-aggregate stress and improves viability in cell models and in Caenorhabditis elegans in vivo Proximity ligation assays also reveal an increased interaction between α-synuclein aggregates and SERCA in human brains affected by dementia with Lewy bodies. We conclude that α-synuclein aggregates bind SERCA and stimulate its activity. Reducing SERCA activity is neuroprotective, indicating that SERCA and down-stream processes may be therapeutic targets for treating α-synucleinopathies.
Keywords: SERCA; aggregation; alpha‐synuclein; calcium; endoplasmic reticulum.
© 2018 The Authors. Published under the terms of the CC BY NC ND 4.0 license.
Figures
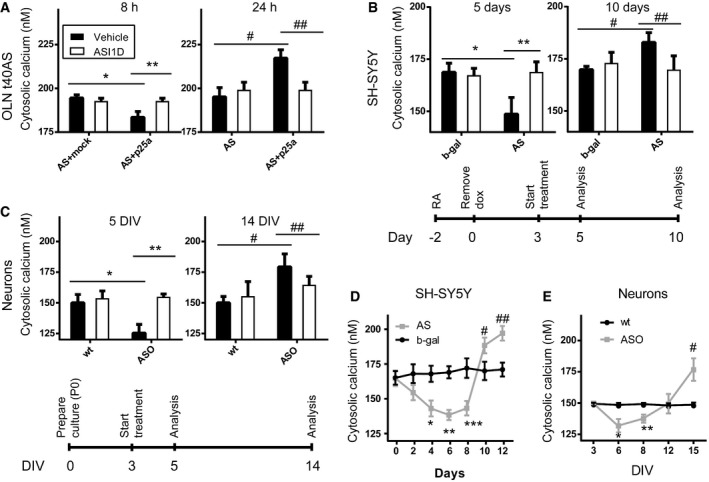
Mitotic OLN‐t40‐AS cells were transfected with p25α and the fluorescent transfection marker tdTomato. OLN‐t40‐AS cells transfected with tdTomato and empty expression vectors served as negative controls. Bars display Ca2+ concentrations as mean ± SD, N = 3 (*P = 0.0001, **P = 0.0002, # P = 0.0011, ## P = 0.0033). The average Ca2+ level of individual experiments was calculated by measuring > 50 or more tdTomato expressing cells.
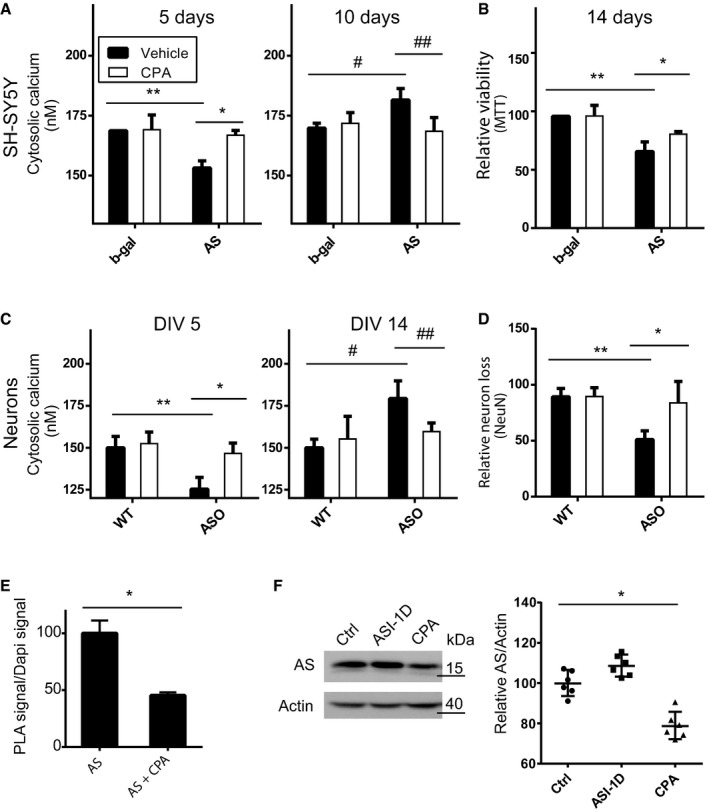
Non‐mitotic SH‐SY5Y cells were generated by treatment with retinoic acid (RA; 10 μM) for 2 days, after which AS expression was induced by removal of doxycycline (dox) and cytosolic Ca2+ measured after 5 days and 10 days of AS expression. See timeline under bars. Cells induced to express β‐galactosidase (b‐gal) upon dox removal were used as negative controls. Bars display Ca2+ concentrations as mean ± SD, N = 4 (*P = 0.0005, **P = 0.0005, # P = 0.0062, ## P = 0.0055). The average Ca2+ level was calculated by measuring > 200 randomly selected cells in each experiment.
Primary hippocampal neurons were isolated from new‐born (P0) mice expressing human AS under the mThy1 promoter and wild‐type (wt) littermates. Cytosolic Ca2+ was measured after 5 days in vitro (5 DIV) and 14 days in vitro culture (14 DIV). See timeline under graphs. Bars display Ca2+ concentrations as mean ± SD, N = 3 (*P = 0.002, **P = 0.0007, # P = 0.0071, ## P = 0.0455). The average cellular Ca2+ is based on > 500 neurons per experiment.
Cytosolic Ca2+ in SHSY5Y cells as in (B) measured every second day. Points represent Ca2+ concentrations as mean ± SD, N = 3 (*P = 0.0377, **P = 0.0057, ***P = 0.03, # P = 0.045, ## P = 0.0229).
Cytosolic Ca2+ in primary hippocampal neurons as in (C) measured every third day. Points represent Ca2+ concentrations as mean ± SD, N = 3 (*P = 0.01, **P = 0.0073, # P = 0.0058).
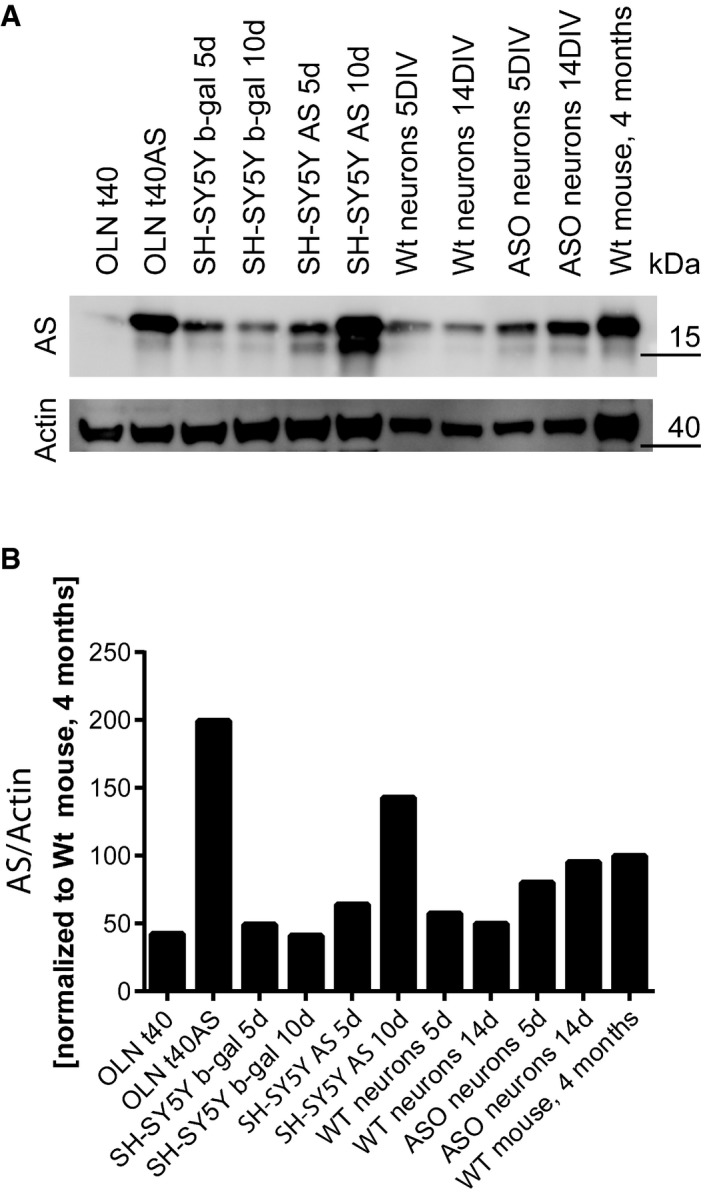
About 10 μg total lysate from the different cell models, primary mouse hippocampal neurons from wild‐type and AS‐transgenic mice (ASO), and total brain homogenate from a wild‐type C57BL/6J mouse were resolved by 10–16% SDS–PAGE probed for α‐syn (ASY‐1), and actin.
The level of AS was quantified and normalised to the actin level. The data are presented with the level in total brain homogenate from 4‐month‐old C57BL/6J mouse arbitrarily numbered as 100.
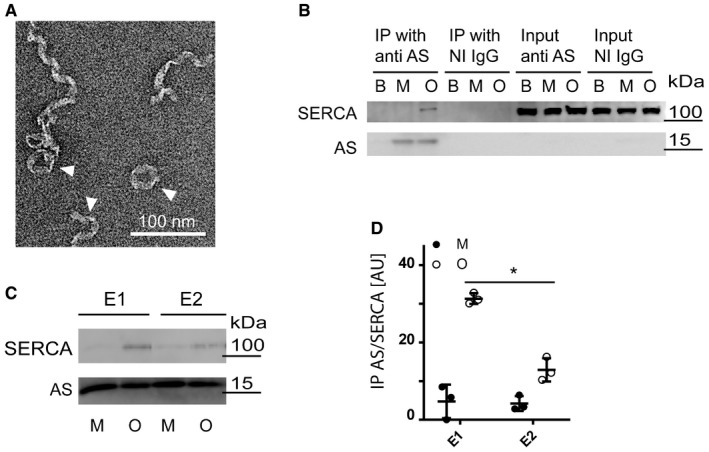
Transmission electron microscopy of freshly isolated oligomers. Arrowheads appoint heterogeneous population of twisted ribbons with a maximum width of 15 nm. 100 nm scale bar is presented.
Purified AS oligomers (O) and monomers (M) were incubated with detergent extract of ASdel mouse brain before being subjected to co‐immunoprecipitation (IP) using ASY‐1 (anti‐AS) and non‐immune rabbit IgG (NI IgG) coupled to sepharose. PBS was used as additional negative control. 2% input of each sample was used as input control. The co‐IP samples were analysed by immunoblotting anti‐SERCA (J15.5) and rabbit polyclonal anti‐AS (ASY‐1). One representative immunoblot of three independent experiments is shown.
The Ca2+‐bound E1‐state of SERCA was stabilised by 5 μM free Ca2+, and the Ca2+‐free E2‐state was stabilised by 1 μM thapsigargin. A representative blot of three replicates is shown.
Quantification of immunoprecipitation experiments in (C). Bars represent geometric mean ± 95% CI of SERCA signal relative to the AS signal. N = 3 (Wilcoxon signed rank test, *P = 0.0382).
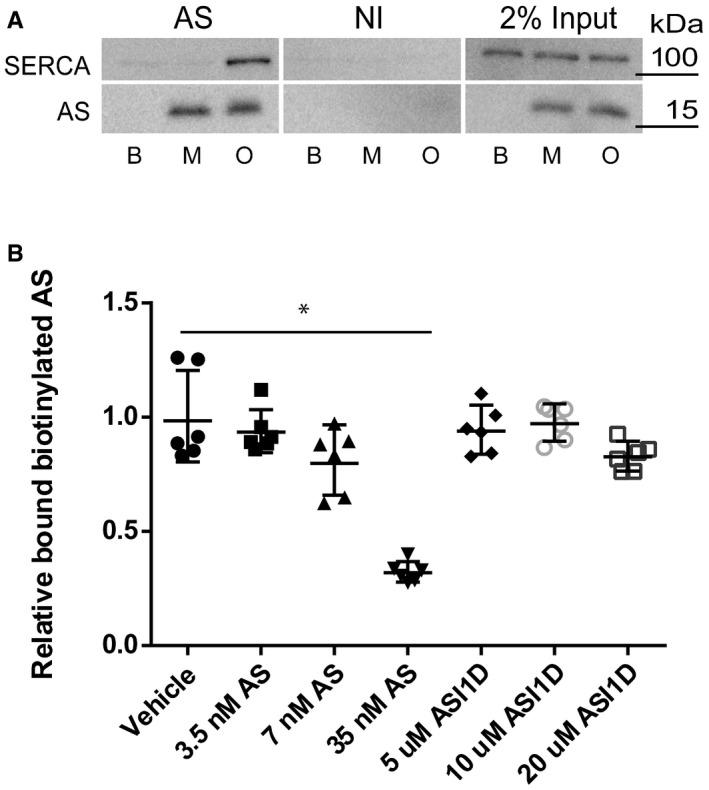
Aggregated AS interacts with SERCA 1A. Purified AS oligomers (O) and monomers (M) were incubated with detergent extract of SERCA1a from sarcoplasmic reticuli isolated from rabbit muscle before being subjected to co‐immunoprecipitation (co‐IP) using anti‐AS (AS) and non‐immune rabbit IgG (NI) coupled to sepharose. PBS was used as additional negative control. 2% input of each sample was used as input control. The co‐IP samples were analysed by immunoblotting using rabbit polyclonal anti‐SERCA (J15.5) and rabbit polyclonal anti‐AS (ASY‐1). A representative blot of three replicates is shown.
ELISA shows that the aggregation inhibitor ASI‐1D does not bind the primary anti‐AS antibody and thereby quench the proximity ligation assay. The aggregation inhibitor ASI‐1D was able to completely abolish the signal from the proximity ligation assay (Fig 3B); therefore, we tested if the binding of the Syn211 antibody to AS can be inhibited by the aggregate inhibitor ASI‐1D. An ELISA assay with 0.7 nM biotinylated AS was developed to test whether increasing amounts of ASI‐1D can compete with biotinylated AS bound to Syn211. Increasing amounts of ASI‐1D cannot compete against the binding of biotinylated AS to Syn211 even at a concentration of 20 μM. As control for the competition, increasing amounts of non‐biotinylated AS were tested, and a concentration of 7 nM AS resulted in ˜20% less bound biotinylated AS, and 35 nM AS reduced the biotinylated AS to ˜30%. This shows that the effect of the aggregate inhibitor in our PLA assay is not caused by inhibition of the binding between Syn211/AS by ASI‐1D. Bars represent mean absorbance ± SD (Kruskal–Wallis one‐way rank test with Dunn's post hoc test, *P = 0.001). N = 3.
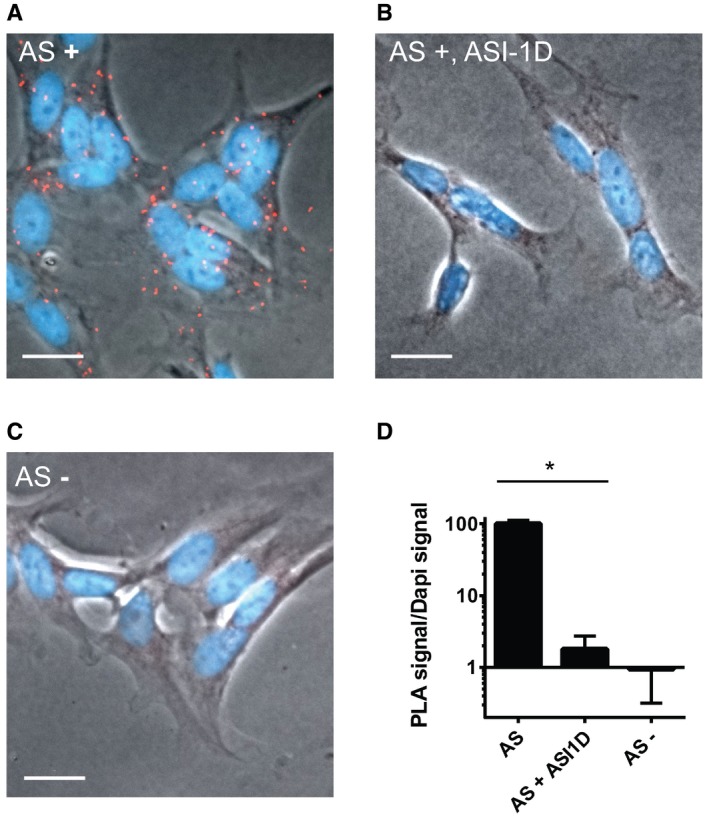
AS‐expressing SH‐SY5Y cells were analysed by proximity ligation assay to demonstrate an intracellular interaction between SERCA and AS using SERCA2 and syn211 as antibody pair. Positive PLA signals are shown as red staining merged with the phase contrast image and DAPI‐stained nuclei (blue). Scale bar is 20 μm.
Proximity ligation assays as in (A), but with cells treated with AS aggregation inhibitor, ASI‐1d, from day 3. Scale bar is 20 μm.
Proximity ligation assay as in (B), but in cells without AS expression. Scale bar is 20 μm.
The signal from proximity ligation assay was quantification as total red fluorescence signal, divided by the DAPI signal to normalise cellular content. In each experiment, 10 microscopic images containing > 100 cells were quantified. Bars represent mean ± SD signal normalised to AS‐expressing cells from three experiments (one‐way ANOVA multiple comparisons with Sidak post hoc test, *P = 0.0001).
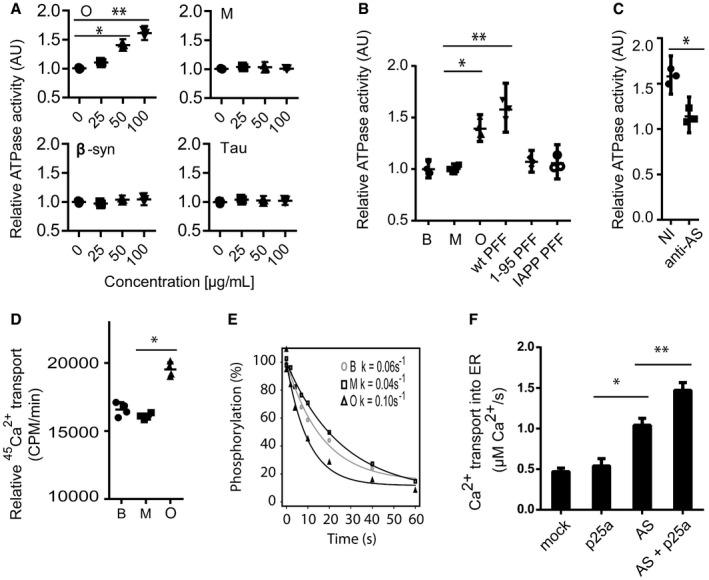
ATPase activity of SERCA was measured as release of inorganic phosphate from ATP. Sarcoplasmic reticulum (SR) vesicles isolated from rabbit skeletal muscle containing SERCA1a were mixed with AS oligomer (O), AS monomer (M), β‐synuclein (β‐syn) or Tau in the presence of ATP (5 mM), Ca2+ (10 μM) and membrane‐permeating ionomycin (2 μM). The ordinate presents ATP hydrolysis within the first 5 min normalised to buffer controls (0 μg/ml). The abscissa presents the concentration of tested proteins. Bars represent the geometric mean of the relative ATP hydrolysis from three individual experiments ± 95% CI (Wilcoxon signed rank test, *P = 0.0482, **P = 0.0034).
ATPase activity of SERCA was measured as in (A) compared to buffer control (B), but in presence of 50 μg/ml AS monomer (M), oligomer (O), sonicated insoluble fibrils assembled from full‐length 1–140 amino acid wild‐type AS (wt PFF), sonicated insoluble fibrils assembled from C‐terminally truncated 1–95 amino acid AS (1–95 PFF) or sonicated insoluble fibrils assembled from islet amyloid polypeptide (IAPP PFF) that represent a control amyloid‐type protein aggregate. Bars represent geometric mean of three individual experiments ± 95% CI (Kruskal–Wallis one‐way rank test with Dunn's post hoc test, *P = 0.0161, **P = 0.0016).
Targeting AS oligomer (50 μg/ml) with rabbit polyclonal ASY‐1 (1 mg/ml) blocked their ATPase‐stimulating activity on SERCA, whereas non‐immune rabbit IgG had no effect. Bars represent the geometric mean of three individual experiments ± 95% CI compared to buffer controls (Wilcoxon signed rank test, *P = 0.048).
SERCA‐dependent Ca2+ transport across rabbit muscle ER membranes was measured by accumulation of 45Ca2+ in ER vesicles in the presence of 50 μg/ml AS oligomers (O), monomer (M) or buffer control (B). Ordinate represents accumulation of 45Ca2+ in SR vesicles per min measured as counts per minute (CPM). Columns represent the geometric mean of three individual experiments ± 95% CI (Wilcoxon signed rank test, *P = 0.011).
The effect of AS oligomers on dephosphorylation of the SERCA E1 state. 32P pre‐phosphorylated SERCA was incubated with 50 μg/ml oligomer (O), 50 μg/ml monomer (M) or buffer control in presence of 10 mM EGTA in order to prevent rephosphorylation of SERCA. The residual 32P‐SERCA was quantified over time by phospho‐imaging of SERCA isolated by acid SDS–PAGE. Ordinate axis represents percentage remaining 32P phosphorylated SERCA and abscissa represents the time. The dephosphorylation rate constants were determined to be k = 0.06/s ± 0.003 for buffer (B), k = 0.04/s ± 0.003 for monomer (M), and k = 0.10/s ± 0.006 for oligomer (O). N = 9 (Kruskal–Wallis one‐way rank test with Dunn's post hoc test, B vs. O: P = 0.0038 and M vs. O: P = 0.0002).
The effect of AS aggregation on Ca2+ transport into ER in living cells was studied in OLN‐t40‐AS transfected with low‐affinity ER‐targeted luminescent aequorin (erAEQ) and co‐expression of p25α to induce aggregation. OLN‐93 cells without AS were used as negative control. The transport of Ca2+ into ER was studied 48 h post‐transfection upon supplementing Ca2+‐depleted cells with 0.5 mM extracellular Ca2+ by measuring increase in luminescence as ER was refilled with Ca2+. Bars represent the mean transport rate of Ca2+ into ER ± SD. N = 15 (one‐way ANOVA multiple comparison with Sidak post hoc test, *P = 0.0001, **P = 0.0023).
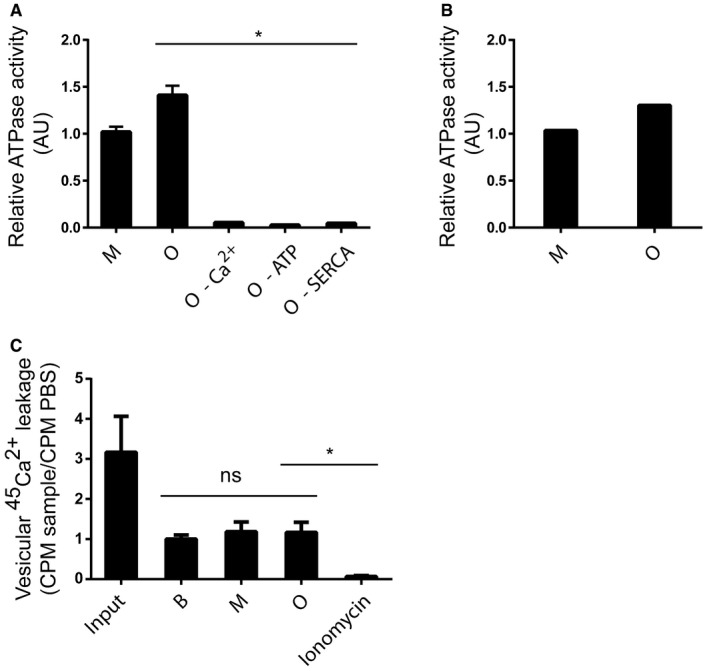
SERCAs ATPase activity was measured as hydrolysis of ATP and release of inorganic phosphate as in Fig 4A–C. Sarcoplasmic reticulum (SR) vesicles isolated from rabbit skeletal muscle containing SERCA1a were mixed with 50 μg/ml AS monomer (M), AS oligomer (O), AS oligomer without Ca2+ (oligomer–Ca2+), AS oligomer in the absence of ATP (oligomer–ATP) or AS oligomer in the absence of SERCA (O–SERCA). Bars represent the average relative ATP hydrolysis ± SD normalised to buffer (Kruskal–Wallis one‐way rank test with Dunn's post hoc test, *P = 0.01). N = 3.
Sarcoplasmic reticulum is a highly specialised muscle form of endoplasmic reticulum; and to validate that the activity is not dependent on this, the SERCA ATPase activity was also measured in ER microsomes extracted from COS cells overexpressing SERCA1a in the presence of 50 μg/ml AS monomer (M) or AS oligomer (O). Bars represent the average relative ATP hydrolysis normalised to buffer from three individual experiments (Wilcoxon signed rank test, *P = 0.0286).
AS oligomers have previously been proposed as forming pores in membranes leading to a leakage of Ca2+. The ability of AS oligomers to form Ca2+ permeable pores was studied in intact microsomes from extracted rabbit muscle preloaded with 45Ca2+. The microsomes were incubated with PBS (B), monomer (M) or oligomer (O) for 1 min before analysis. Ionomycin‐treated microsomes served as positive control for completely permeabilised membranes. No difference in 45Ca2+ efflux could be demonstrated between PBS and the AS preparations in contrast to ionomycin that caused release of all 45Ca2+ from the microsomes. Bars represent the average 45Ca2+ CPM ± SD remaining after 5 min normalised to PBS from three individual experiments (Kruskal–Wallis one‐way rank test with Dunn's post hoc test, *P = 0.0427).
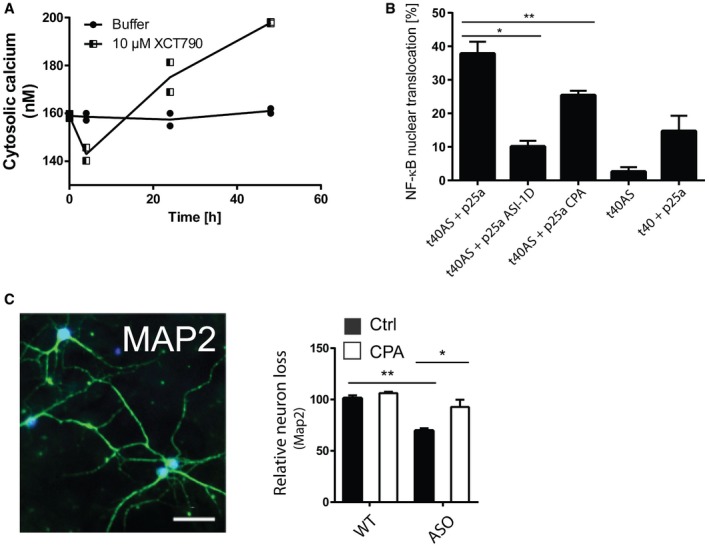
Allosteric activation of SERCA by XCT790 mimics the early decrease and later increase in Ca2+ observed upon intracellular AS aggregation. Cytosolic Ca2+ levels were quantified by the Ca2+ sensor Fura‐2 and converted to absolute values using the Fura‐2 Calcium Imaging Calibration Kit. Non‐mitotic SH‐SY5Y wt cells were generated by treatment with 10 μM retinoic acid for 2 days before treatment with SERCA activator, 10 μM XCT790 (Sigma‐Aldrich). The cytosolic Ca2+ in SH‐SY5Y cells was measured after 4, 24 and 48 h. Points represent Ca2+ concentrations as mean ± SD, N = 2.
CPA reduces NF‐κB nuclear translocation in OLN cells. Aggregation of AS in OLN cells by co‐expression of AS and p25a generates a cell stress that increases nuclear translocation of NF‐κB (p65), which can be rescued by ASI‐1D treatment 10. Bars represent the average percentage of transfected cells with NF‐κB translocated to the nucleus ± SD in > 100 transfected cells in each experiment (one‐way ANOVA multiple comparisons with Sidak post hoc test, *P = 0.0001 and **P = 0.0006). N = 3.
Survival of neurons from day 6 to day 14 was quantified by counting MAP2‐positive cells. Representative MAP2 staining pattern (green) of primary hippocampal neurons with NeuN marking neuronal nuclei. Scale bar is 50 μm. Bars represent remaining MAP‐2‐positive neurons at day 14 normalised to the number present at day 6, presented as means of three individual experiments ± SD each of > 300 neurons (one‐way ANOVA multiple comparisons with Sidak post hoc test, *P = 0.0003, **P = 0.0001).
Non‐mitotic SH‐SY5Y cells were treated with 0.5 μM CPA beginning after 3 days of AS/b‐gal expression started using DMSO as solvent control. Bars display Ca2+ concentrations as mean ± SD, N = 3 (one‐way ANOVA multiple comparisons with Sidak post hoc test, *P = 0.014, **P = 0.0031, # P = 0.0254, ## P = 0.0145). The average Ca2+ level was calculated by measuring > 200 randomly selected cells in each experiment.
Viability of the SHSY5Y cells was measured by the MTT assay for mitochondrial oxidoreductase activity after 14 days of AS or b‐gal expression with CPA (0.5 μM) treatment from day 3. Bars represent relative viability normalised to vehicle‐treated b‐gal cells displayed as mean ± SD. N = 3 (one‐way ANOVA multiple comparisons with Sidak post hoc test, *P = 0.0002, **P = 0.0304).
Primary hippocampal neurons from P0 mice expressing human AS (ASO) under the mThy1 promoter and wild‐type (wt) littermates were treated with 0.5 μM CPA from day 3 in vitro (DIV 3). Cytosolic Ca2+ was measured at DIV 5 and DIV 14. Bars represent Ca2+ concentrations as mean ± SD, N = 3 (one‐way ANOVA multiple comparisons with Sidak post hoc test, *P = 0.0041, **P = 0.0095, # P = 0.0081, ## P = 0.0461). The average Ca2+ level was calculated by measuring > 500 randomly selected neurons in each experiment.
Survival of neurons from day 6 to day 14 was quantified by counting NeuN‐positive nuclei. Bars represent remaining Neu+ neurons at day 14 normalised to the number present at day 6, presented as means ± SD of four individual experiments with > 400 neurons (one‐way ANOVA multiple comparisons with Sidak post hoc test, *P = 0.0033, **P = 0.0137).
To test the effect of CPA treatment on the interaction between SERCA and AS aggregates, non‐mitotic SH‐SY5Y cells expressing AS for 5 days were treated with 0.5 μM CPA during the last 2 days. The cells were subjected to AS‐SERCA PLA using SERCA2 and syn211 as antibody pair as described in Fig 3. The total red fluorescence signal from the PLA was divided by the DAPI signal to normalise for cellular content. In each experiment, 10 microscopic images containing > 100 cells were quantified. Data are presented as normalised to the signal from non‐CPA‐treated cells. Bars represent mean ± SD signal normalised to AS‐expressing cells from three experiments (one‐way ANOVA multiple comparisons with Sidak post hoc test *P = 0.0001).
α‐syn levels in differentiated SH‐SY5Y cells expressing α‐syn for 5 days, and treated the last 2 days with 20 μM ASI‐1D or 0.5 μM CPA, were measured by immunoblotting. Representative immunoblot is presented. Quantification of α‐syn normalised to the actin loading control is presented as geometric mean ± 95% CI for six independent experiments (Wilcoxon signed rank test, *P = 0.0313).
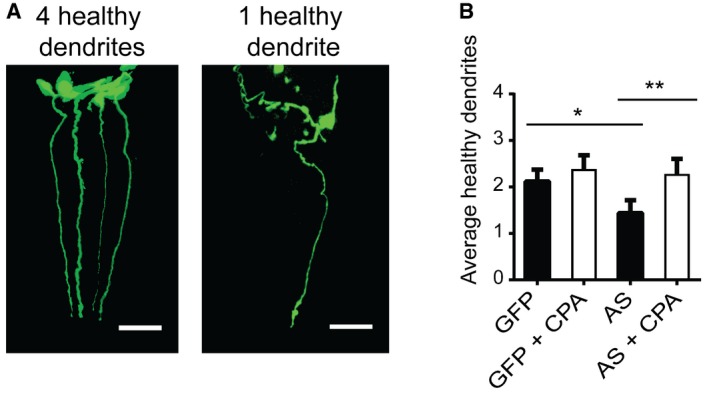
Representation of an 8‐day‐old Pdat‐1::GFP worm with four intact CEP neurons determined by the presence of intact anterior projecting dendrites (left) and an 8‐day‐old Pdat‐1::GFP/AS worm with one remaining dendrite (right). Images are 3D reconstructions of z‐stacks obtained at 63× magnification. Scale bar is 20 μm.
Quantification of average number of intact CEP neurons per C. elegans upon CPA treatment. CPA treatment of C. elegans started at day 3. Bars represent the average number of healthy dendrites projecting from CEP neurons ± SD. N = 4 (one‐way ANOVA multiple comparisons with Sidak post hoc test, *P = 0.0146, **P = 0.0008). > 35 worms per experiment.
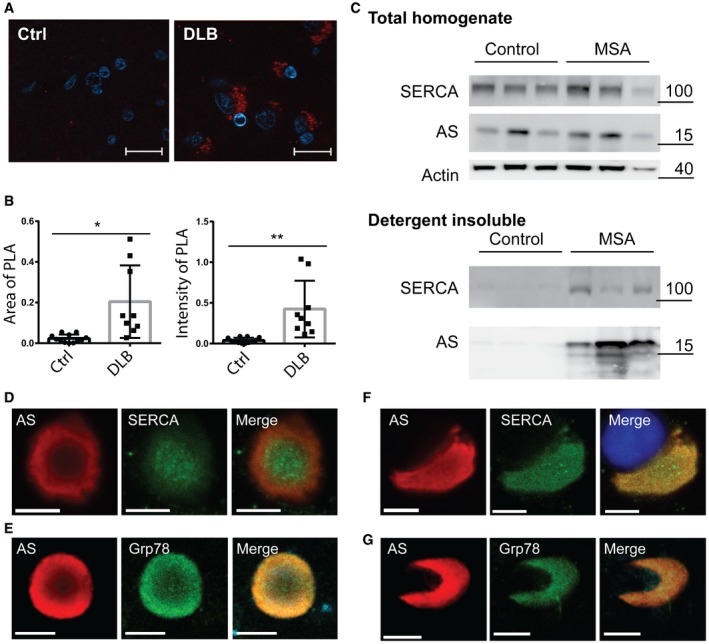
Representative image of proximity ligation assay using SERCA2 and syn211 as antibody pair on 5‐μm sections paraffin‐embedded human frontal cortex from DLB case (DLB) and occipital cortex from neurological healthy case (Ctrl). Scale bar is 20 μm.
The proximity ligation signal was quantified in 10 randomly distributed microscopic images using ImageJ as mean area ± SD covered by PLA signal (left graph) and mean PLA intensity ± SD in the covered area (right graph) of signal above 3× the background signal (Student's t‐test, *P = 0.0023, **P = 0.0011).
Immunoblot analysis of extracts from human cerebellar dentate nucleus from three neurological healthy cases (Control) and three cases with multiple system atrophy (MSA). Presented is the total homogenate and the detergent‐insoluble fraction solubilised in 5% SDS, 8 M urea prior to immonoblotting analysis (detergent insoluble). The molecular markers for the individual immunoblots are presented to the right of the panels.
Immunostaining of isolated Lewy body (LB) from a PD patient labelled for AS and SERCA2 immunoreactivity. Scale bar is 5 μm.
Immunostaining of isolated LB from a patient with DLB labelled for AS and ER marker GRP78. GRP78 reactivity is present in the inclusion. Scale bar is 7.5 μm.
Immunostaining of isolated glial cytoplasmic inclusion (GCI) from MSA patient labelled for AS and SERCA. DAPI stains a co‐isolated oligodendrocyte nucleus. Scale bar is 5 μm.
Immunostaining of isolated GCI from MSA patient labelled for AS and GRP78. Scale bar is 7.5 μm.
References
-
- Nussbaum RL (2017) Genetics of synucleinopathies. Cold Spring Harb Perspect Med https://doi.org/10.1101/cshperspect.a024109 - DOI - PMC - PubMed
-
- Pasternak B, Svanstrom H, Nielsen NM, Fugger L, Melbye M, Hviid A (2012) Use of calcium channel blockers and Parkinson's disease. Am J Epidemiol 175: 627–635 - PubMed
-
- Hurley MJ, Brandon B, Gentleman SM, Dexter DT (2013) Parkinson's disease is associated with altered expression of CaV1 channels and calcium‐binding proteins. Brain 136: 2077–2097 - PubMed
-
- Hurley MJ, Gentleman SM, Dexter DT (2015) Calcium CaV1 channel subtype mRNA expression in Parkinson's disease examined by in situ hybridization. J Mol Neurosci 55: 715–724 - PubMed
Publication types
MeSH terms
Substances
Grants and funding
LinkOut - more resources
Full Text Sources
Other Literature Sources
Molecular Biology Databases
Miscellaneous
