. 2018 May 17;51(5):1702652.
doi: 10.1183/13993003.02652-2017. Print 2018 May.

The in vitro effect of nebulised hypertonic saline on human bronchial epithelium

Affiliations

The in vitro effect of nebulised hypertonic saline on human bronchial epithelium

Jennifer L Goralski et al. Eur Respir J. .

Abstract

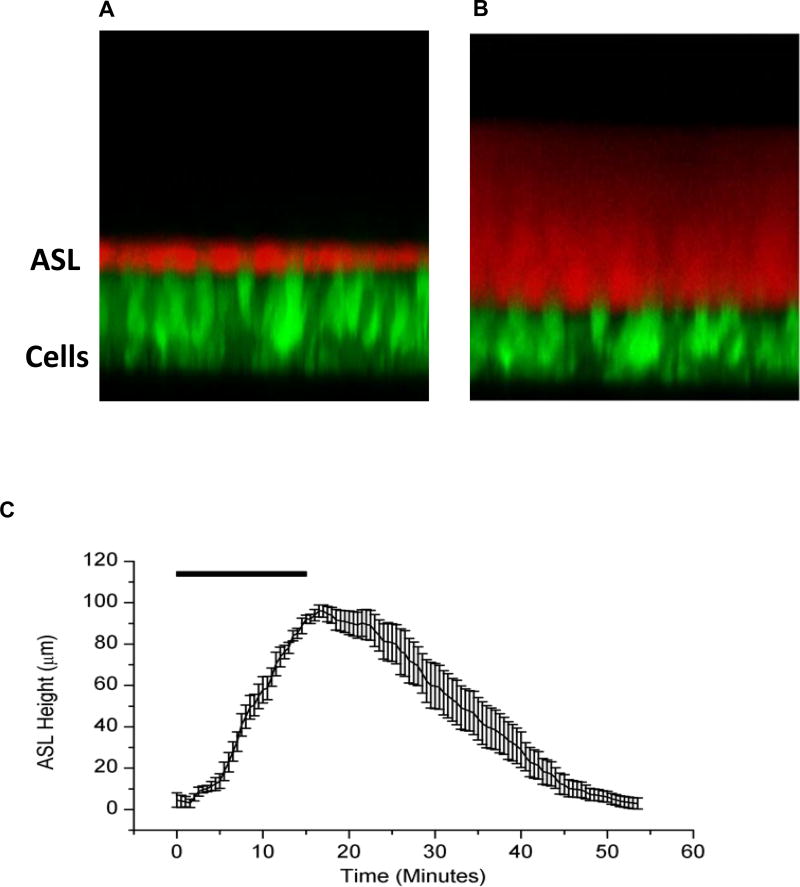
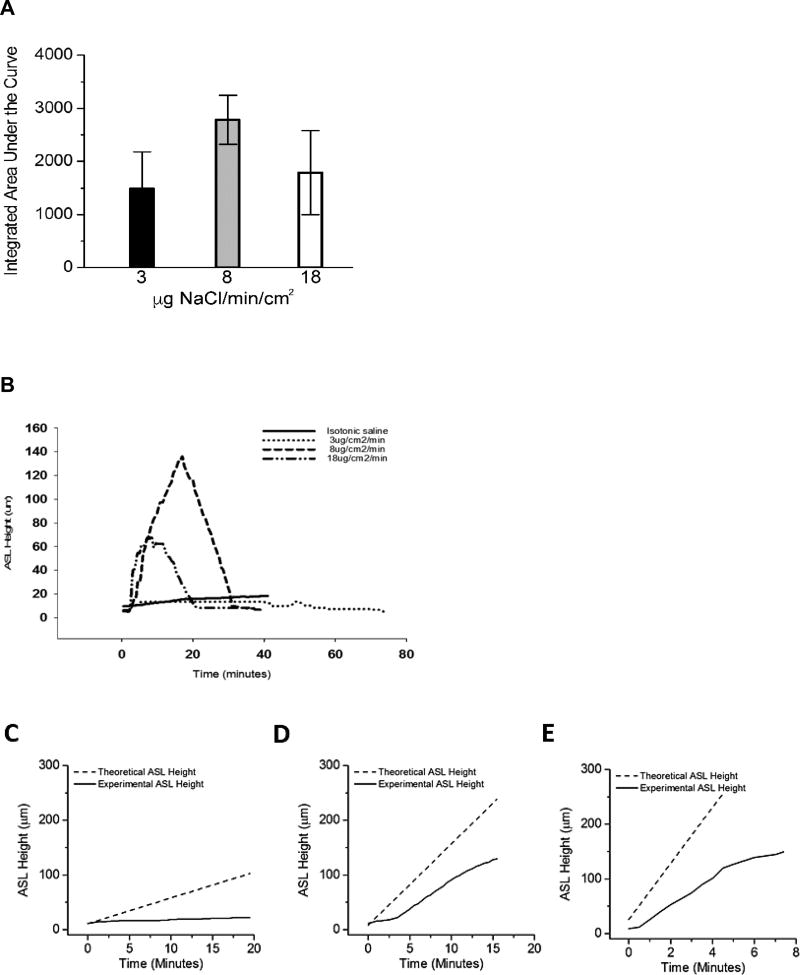
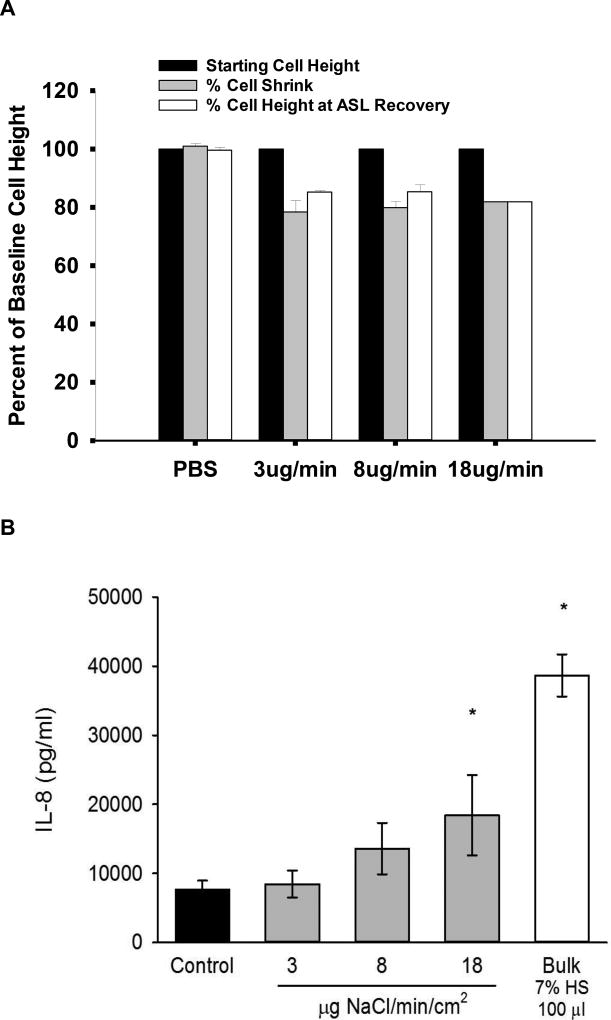
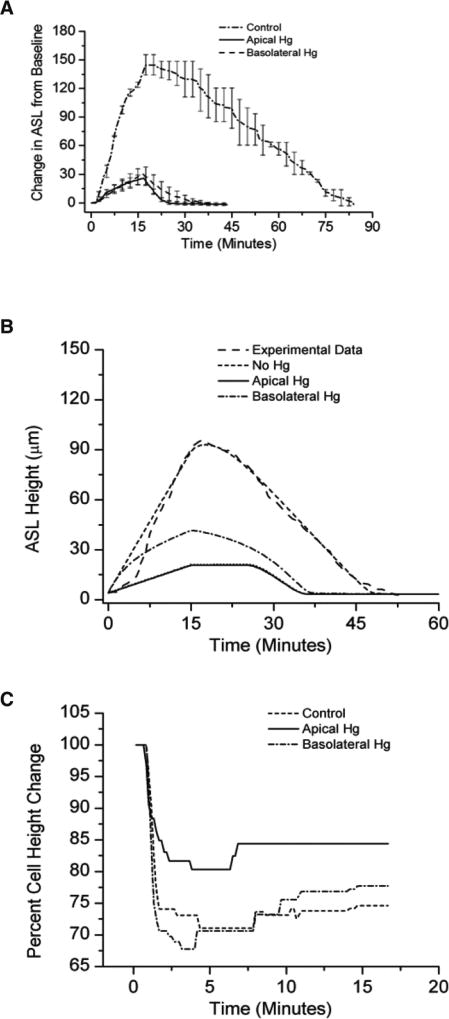
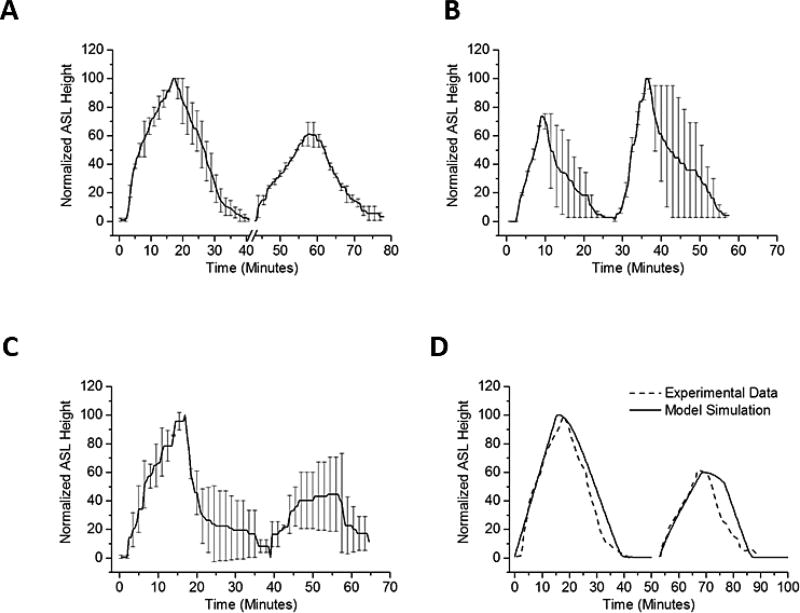
Inhaled hypertonic saline (HS) is an effective therapy for muco-obstructive lung diseases. However, the mechanism of action and principles pertinent to HS administration remain unclear.An in vitro system aerosolised HS to epithelial cells at rates comparable to in vivo conditions. Airway surface liquid (ASL) volume and cell height responses were measured by confocal microscopy under normal and hyperconcentrated mucus states.Aerosolised HS produced a rapid increase in ASL height and decrease in cell height. Added ASL volume was quickly reabsorbed following termination of nebulisation, although cell height did not recover within the same time frame. ASL volume responses to repeated HS administrations were blunted, but could be restored by a hypotonic saline bolus interposed between HS administrations. HS-induced ASL hydration was prolonged with hyperconcentrated mucus on the airway surface, with more modest reductions in cell volume.Aerosolised HS produced osmotically induced increases in ASL height that were limited by active sodium absorption and cell volume-induced reductions in cell water permeability. Mucus on airway surfaces prolonged the effect of HS via mucus-dependent osmotic forces, suggesting that the duration of action of HS is increased in patients with hyperconcentrated mucus.


Conflict of interest statement

Conflict of interest: R.C. Boucher reports personal fees from Parion Sciences, outside the submitted work. Conflict of interest: W.R. Thelin is an employee of Parion Sciences and reports non-financial support, outside the submitted work; in addition, he has a patent – VX-371 is a patented molecule licensed to Vertex Pharmaceuticals.

Figures

Figure 1
Figure 1
(A) XZ-confocal image of a cross section of airway epithelial cells stained with Calcein, a fluorescent green dye, and ASL stained with Texas Red Dextran, a cell impermeable red dye. (B) After administration of an osmotic stimulus (HS), there is an increase in ASL height along with a decline in cell height. (C) HS aerosolized to the surface of HBE cultures results in a significant but transient increase in ASL height, lasting under an hour. n=8 for each experiment. Rectangle represents duration of HS administration (8µg NaCl/cm2/min for 15 min).
Figure 2
Figure 2
Effects of variation in HS delivery rates on ASL volumes responses. (A) Comparison of ASL heights achieved with three rates of nebulized HS (low, 3µg NaCl/cm2/min; moderate, 8 µg NaCl/cm2/min; and high, 18 µg NaCl/cm2/min) with duration varied to hold constant total delivered mass of salt (demonstrated by length of bar at top). Isotonic saline showed for comparison. p<0.05 for all groups compared to isotonic saline control. (B) Both absolute height change and total hydration (integrated area over time) favored the mid-range dosing regimen but did not reach statistical significance (A; p=0.373). (C,D,E) Dashed lines indicates the expected rise in ASL height if all salt deposited resulted in an equimolar flux of water into the ASL. Solid black lines indicate the actual change in ASL height observed during experiments. The failure of these two lines to overlay indicates an inhibition of the transport of water from the epithelial cells into the ASL. (C) Low dose nebulization (3 µg NaCl/cm2/min). Theoretical slope 4.72 µm/min versus experimental slope of 0.45 µm/min, p<0.001. (D) Medium dose nebulization (8 µg NaCl/cm2/min). Theoretical slope 14.92 µm/min versus experimental slope of 8.66 µm/min, p<0.001. (E) High dose nebulization (18 µg NaCl/cm2/min). Theoretical slope 51.49 µm/min versus experimental slope of 20.78 µm/min, p<0.001. N=4 per experimental condition.
Figure 3
Figure 3
Effect of sodium reabsorption on HS-mediated ASL height. (A) Experimental data of hypertonic saline (at 8 µg NaCl/cm2/min) in the absence and presence of a potent sodium channel blocker (VX-371 at 50 µg/ml). (B) Mathematical model predictions of the HS effect with normal ENaC conductance (solid line, consistent with experimental data) and 15% of ENaC channel normal conductance (dashed line).
Figure 4
Figure 4
(A) Cell volume changes in response to osmotic stimulus of HS at varying HS deposition rates. A 20% decrease in cell height in response to the hypertonic stimulus was observed at all rates, which was significantly different from baseline and isotonic (PBS) saline administration (p<0.01 by Holm-Sidak method). Cell height did not recover during the time frame of the experimentation (60 minutes). Cell volume reduction was a consistent finding regardless of rate of HS administration. (n=4 for each condition). (B) Production of IL-8 in response to increasing doses of nebulized or bulk HS. Statistically different from control (PBS) at the 18 µg dose (p<0.002 by Holm-Sidak method) and bulk dosing (100µl of 7% HS) (p<0.001).
Figure 5
Figure 5
Incubation with mercury chloride apically or basolaterally resulted in a diminished ASL response to aerosolized HS (at 8µg NaCl/cm2/min) compared with native cultures. (A) Experimental data. p<0.001 via Holm-Sidak method for comparisons to control. (B) Mathematical model of experimental data. N=8 for each condition. (C) Cell height change to aerosolized HS in the absence (control) or presence of selective block of the apical or basolateral cell membrane with mercury chloride (p<0.001 for all comparisons).
Figure 6
Figure 6
Sequential ASL volume responses to aerosolized 7% HS for 15 min (8µg NaCl/cm2/min). (A) Sequential ASL volume responses to aerosolized HS. A smaller ASL response to a second administration of aerosolized HS was observed when two identical HS doses were separated by 15 minutes. Break in x-axis indicate time between two doses. For each dose, HS was nebulized at 8 µg NaCl/cm2/min, administered continuously for 15 minutes. The ASL height of the second peak was about 60% of the first peak. P<0.001 by Mann-Whitney Rank Sum test. (B) A hypotonic saline rinse was interposed between HS administration. The hypotonic solution administration produced cellular swelling associated with improved ASL volume responses to a subsequent administration of HS (~140% of first dose). The difference in response was statistically significant (p=0.002 via Mann-Whitney Rank Sum test) in favor of the post-hypotonic peak. (C) Interposition of an isotonic rinse between the first and second HS administration. The same second dose effect is not seen when doses of HS were separated by an isotonic saline bolus. (p=0.78 by Mann-Whitney Rank Sum Test). ASL height of second peak persisted ~50% of the first peak. (D) In model simulation, the water permeability of the HBE apical membrane during the second dose was reduced to 10% of the basal water permeability. N=4 for each condition.
Figure 7
Figure 7
The effects of hyperconcentrated mucus on HBE surfaces on nebulized HS (at 8µg NaCl/cm2/min) in inducing ASL volume responses. (A) In the normal (2% mucus) state (solid line), there was a 3-fold increase in ASL volume during nebulization. HBE cultures with hyperconcentrated mucus (12%) (Dashed line) exhibited a 7-fold increase in ASL above baseline ASL. The duration of ASL being increased above basal levels was also increased in hyperconcentrated mucus HBE cultures. (B) Rates of reabsorption (time to baseline ASL, in µm/min) were significantly different between the normal and the hyperconcentrated mucus cultures. P=0.052 by Mann-Whitney Rank Sum Testing. (C) Two sequential doses of HS administered to hyperconcentrated cultures. ASL height difference favors the second dose (p<0.001). (D) Dashed line indicates the expected rise in ASL height if all salt deposited remained on the surface and resulted in an equimolar flux of water into the ASL. Solid line indicates the actual change in ASL height observed during experiments. Compare to Figures 2C–E: In the presence of an intact mucus layer (12% solids), actual and expected ASL height more closely approximated each other early in the HS delivery interval.

Comment in

References

    1. Boucher RC. Evidence for airway surface dehydration as the initiating event in CF airway disease. J Intern Med. 2007;261(1):5–16. - PubMed
    1. Button B, Cai LH, Ehre C, et al. A periciliary brush promotes the lung health by separating the mucus layer from airway epithelia. Science. 2012;337(6097):937–941. - PMC - PubMed
    1. Bush A, Payne D, Pike S, Jenkins G, Henke MO, Rubin BK. Mucus properties in children with primary ciliary dyskinesia: comparison with cystic fibrosis. Chest. 2006;129(1):118–123. - PubMed
    1. Redding GJ, Kishioka C, Martinez P, Rubin BK. Physical and transport properties of sputum from children with idiopathic bronchiectasis. Chest. 2008;134(6):1129–1134. - PubMed
    1. Donaldson SH, Bennett WD, Zeman KL, Knowles MR, Tarran R, Boucher RC. Mucus clearance and lung function in cystic fibrosis with hypertonic saline. N Engl J Med. 2006;354(3):241–250. - PubMed

Publication types

MeSH terms

LinkOut - more resources