. 2018 Jul;17(7):1432-1447.
doi: 10.1074/mcp.TIR118.000661. Epub 2018 Mar 29.

A Structured Workflow for Mapping Human Sin3 Histone Deacetylase Complex Interactions Using Halo-MudPIT Affinity-Purification Mass Spectrometry

Affiliations

A Structured Workflow for Mapping Human Sin3 Histone Deacetylase Complex Interactions Using Halo-MudPIT Affinity-Purification Mass Spectrometry

Charles A S Banks et al. Mol Cell Proteomics. 2018 Jul.

Abstract

Although a variety of affinity purification mass spectrometry (AP-MS) strategies have been used to investigate complex interactions, many of these are susceptible to artifacts because of substantial overexpression of the exogenously expressed bait protein. Here we present a logical and systematic workflow that uses the multifunctional Halo tag to assess the correct localization and behavior of tagged subunits of the Sin3 histone deacetylase complex prior to further AP-MS analysis. Using this workflow, we modified our tagging/expression strategy with 21.7% of the tagged bait proteins that we constructed, allowing us to quickly develop validated reagents. Specifically, we apply the workflow to map interactions between stably expressed versions of the Sin3 subunits SUDS3, SAP30, or SAP30L and other cellular proteins. Here we show that the SAP30 and SAP30L paralogues strongly associate with the core Sin3 complex, but SAP30L has unique associations with the proteasome and the myelin sheath. Next, we demonstrate an advancement of the complex NSAF (cNSAF) approach, in which normalization to the scaffold protein SIN3A accounts for variations in the proportion of each bait capturing Sin3 complexes and allows a comparison among different baits capturing the same protein complex. This analysis reveals that although the Sin3 subunit SUDS3 appears to be used in both SIN3A and SIN3B based complexes, the SAP30 subunit is not used in SIN3B based complexes. Intriguingly, we do not detect the Sin3 subunits SAP18 and SAP25 among the 128 high-confidence interactions identified, suggesting that these subunits may not be common to all versions of the Sin3 complex in human cells. This workflow provides the framework for building validated reagents to assemble quantitative interaction networks for chromatin remodeling complexes and provides novel insights into focused protein interaction networks.

Keywords: Affinity tagging; Chromatin function or biology; Imaging; Label-free quantification; Macromolecular complex analysis; Networks*; Protein complex analysis; Protein-Protein Interactions*.


Figures

Fig. 1.
Fig. 1.
Establishing a structured workflow for mapping Sin3 complex interactions. A, Sin3 subunit ORFs are first cloned into pFN21A for transient CMV driven expression of the N-terminally Halo tagged subunit in 293T cells ➀. The pFN21A construct is used in trial AP-MS experiments to assess whether the recombinant subunit can capture other known Sin3 subunits ➁. If the Halo- tagged subunit copurifies with Sin3 complex components, the subunit ORF is cloned into pcDNA5/FRT for building Flp-In™-293 cell lines ➂; otherwise, the bait protein is reengineered by changing the location of the affinity tag or it's expression is increased by adjusting the strength of the promoter ➃. The pcDNA5/FRT construct is tested for bait expression in 293T cells prior to generating cell lines expressing the Halo-tagged subunit using the weak CMVd2 promoter. Clonal isolates are screened by SDS-PAGE followed by Western blotting and three isolates expressing each Halo-tagged subunit are screened for correct localization of the subunit to the nucleus using fluorescently-tagged cell-permeable Halo ligands ➄. Finally, complexes are purified from ∼1 × 10⁹ Flp-In™-293 cells stably expressing the Halo tagged subunit and analyzed by MudPIT ➅. B, Application of the workflow to developing 23 Sin3 related stable cell lines for AP-MS analysis. Of the 5 cases where we modified the bait expression strategy, we used a higher strength promoter for detectable expression in 3 cases and switched tag location in another 2 cases (the tag caused both improper association with Sin3 complexes and abnormal localization). C, An example of affinity tag location influencing bait localization in HEK293T cells expressing either Halo-HDAC2 or HDAC2-Halo. Halo tag localization in live cells is with HaloTag® TMRDirect™ fluorescent ligand (red); nuclei are stained with Hoechst dye (blue). D, Temporal (green) and economic (blue) impact of testing transiently transfected bait constructs prior to investigating cell lines stably expressing baits.
Fig. 2.
Fig. 2.
Transiently transfected Halo-SUDS3 and Halo-SAP30 associate with other Sin3 complex components. A, Halo-MudPIT analysis of transiently expressed Halo-SUDS3. Protein complexes were Halo affinity purified from HEK293T cells transiently transfected with Halo-SUDS3 in pFN21A (3 replicates) or Halo tag alone controls (9 replicates). Proteins in the eluates were identified by digesting samples with trypsin prior to separating tryptic peptides using multidimensional chromatography for mass spectrometry analysis (MudPIT). Proteins identified in each replicate were quantitated by spectral counting: proteins significantly enriched in Halo-SUDS3 compared with control samples were identified using QSPEC (18) (QSPEC log2FC > 2, QSPEC FDRUP < 0.05, detected in > 50% replicates; supplemental Table S2). B, Gene ontology terms (cellular component) enriched in Halo-SUDS3 or Halo-SAP30 complexes. Groups of proteins significantly enriched with either Halo-SUDS3 or Halo-SAP30 in pFN21A transiently expressed in HEK293T cells were analyzed for GO term enrichment (cellular component) using the DAVID annotation tool (27) (supplemental Table S2, “DAVID analysis results”). Significantly enriched GO terms (padj < 0.05) were summarized using REViGO (57) (supplemental Table S2, “Revigo analysis results”); treemap segment areas are proportional to -log10padj. C, Sin3 complex subunits copurify with both Halo-SUDS3 and Halo-SAP30. dNSAF values for Sin3 subunits copurifying with Halo-SUDS3 or Halo-SAP30 visualized using Circos (58). Values indicated are dNSAFav × 10000. Bait dNSAF values have been set to 0 for visualization. D, Expression of SAP25 and SAP18 mRNA in HEK293T cells. FPKM values (Fragments Per Kilobase of transcript per Million fragments mapped) for the indicated Sin3 subunit transcripts are taken from our previously published RNA-seq dataset (4) available from the NCBI GEO (Gene Expression Omnibus) repository under the accession number: GSE79656. Values are the mean of 3 biological replicates. Error bars represent standard deviation. E, SUDS3 and SAP30 copurify with Halo-SAP25, but not with Halo-SAP18 or SAP18-Halo. Halo purified samples from HEK293T cell lysates transfected with either Halo-SAP25, Halo-SAP18, SAP18-Halo, or a control plasmid expressing the Halo tag alone were resolved by SDS-PAGE. Copurifying proteins were either detected by Coomassie staining or by Western blotting using the antibodies indicated. The Coomassie stained bands corresponding to the bait protein after Halo tag cleavage are indicated by yellow asterisks. F, Halo-SUDS3 and Halo-SAP30 stably expressed in Flp-In™-293 cells localize to the nucleus. Flp-In™-293 cells were cotransfected with pOG44 and Halo-SUDS3 or Halo-SAP30 (in CMVd2 pcDNA5/FRT PacI PmeI) and colonies of hygromycin resistant cells isolated and screened for recombinant protein expression by SDS page and Western blotting. Western blots were probed with rabbit anti-Halo polyclonal antibodies and IRDye® 800CW labeled anti-Rabbit secondary antibodies together with anti-tubulin mouse monoclonal antibodies and IRDye® 680LT labeled goat anti-Mouse secondary antibodies (loading control). Western blots were imaged using a Li-Cor infra-red imaging system. Subcellular localization of Halo-SUDS3 and Halo-SAP30 proteins was assessed by labeling live cells with HaloTag® TMRDirect™ fluorescent ligand (red) and staining DNA (nuclei) with Hoechst dye (blue).
Fig. 3.
Fig. 3.
Evaluating complexes purified from Sin3 stable cell lines. A, Complexes purified from Flp-In™-293 cells expressing CMVd2 driven Halo-SUDS3. Complexes were purified from five replicates of ∼1 × 10⁹ Flp-In™-293 cells stably expressing Halo-SUDS3 using the CMVd2 promoter. Proteins present in the eluates were resolved by SDS-PAGE using 4–15% gradient gels and visualized by silver staining (replicate 4, clone #14 is shown as a representative example). Three biologically distinct clonal Halo-SUDS3 cell lines were used (clone #2, replicate 1; clone #14, replicates 2 and 4; clone #24, replicates 3 and 5) and replicate purifications were performed by two people (replicates 1 and 3 by CAB and replicates 2, 4 and 5 by JLT) on five separate dates to avoid batch effects. B, Sin3 subunits identified in complexes purified from Flp-In™-293 cell lines stably expressing Halo-SUDS3, Halo-SAP30 and Halo-SAP30L. Proteins from replicate purifications were digested with trypsin and identified using MudPIT (Fig. 2A and supplemental Tables S1 and S3). Average dNSAF values for components of the Sin3 complex (green and blue) and Sin3 associated transcription factors (pink) have been visualized using Genesis (59). C, Gene ontology terms (cellular component) enriched in complexes purified from cells stably expressing Halo-SUDS3, Halo-SAP30 or Halo-SAP30L. Groups of proteins significantly enriched (QSPEC log2FC > 2, QSPEC FDRUP < 0.05, detected in > 50% replicates) with Halo-SUDS3, Halo-SAP30 or Halo-SAP30L were identified (supplemental Table S3): the overlap among these groups was visualized using Venny (60). Gene Ontology terms (cellular component) enriched in the indicated subgroups (padj < 0.05) were determined using the ClueGO/CluePedia tool (ClueGO v2.3.3 and CluePedia v1.3.3) with default settings (33)(34). Protein connections to enriched GO terms are indicated (red).
Fig. 4.
Fig. 4.
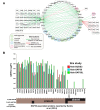
Halo-MudPIT analysis extends network of STRING annotated Sin3 subunit interactions. A, Complexes were purified from Flp-In™-293 cells stably expressing Halo-SUDS3, Halo-SAP30 or Halo-SAP30L (bait proteins - green hexagons). Proteins significantly enriched in these bait purifications were identified by Halo-MudPIT AP-MS (QSPEC log2FC > 2, QSPEC FDRUP < 0.05, detected in > 50% replicates; supplemental Table S3). Interactions derived from published experimental evidence for proteins interacting with human SUDS3, SAP30 and SAP30L were retrieved from the STRING database (38) (medium confidence interactions (STRING score > 0.4). Halo-bait captured and STRING annotated interactions were compared using the DyNet analysis tool (39). Interactions detected by Halo-bait only (green edges), STRING only (red edges) or by both Halo-bait and STRING (gray edges) are indicated. Nodes representing core Sin3 subunits (green circles/hexagons), other Sin3 associated proteins (blue circles) or Sin3 associated transcription factors (pink circles) have been highlighted. B, Previously reported FLAG-SAP30 and FLAG-SAP30L associated proteins (Sardiu et al. 2014 Fig. 1A (5)) identified in Halo-SUDS3, Halo-SAP30 and Halo-SAP30L purifications in this study. Sardiu et al. identified 31 Sin3 associated proteins, 30 of which copurified with FLAG tagged versions of either SAP30 or SAP30L (indicated by brown rectangles). The bar graph indicates the enrichment of these proteins in Halo purifications from cell lines stably expressing Halo-SUDS3 (red), Halo-SAP30 (aqua), or Halo-SAP30L (green).
Fig. 5.
Fig. 5.
Relative Sin3 subunit composition for different bait purifications. A, Upper bar chart—mean cNSAF values for Sin3 subunits and the transcription factors FOXK1 and FOXK2 purified from cells stably expressing Halo-SUDS3, Halo-SAP30 or Halo-SAP30L. Lower bar chart—the cNSAF values shown in A have been normalized to the cNSAF value of the key subunit SIN3A for each replicate; bars are the mean value of cNSAFprey/cNSAFKS. Bars representing detection of the bait are shown in gray. Error bars represent standard deviation. B, Some baits might capture more endogenous Sin3 complexes than others relative to the amount of bait: this could account for different cNSAF values for a prey captured using different baits. To account for different propensities of different baits to capture Sin3 complexes, cNSAF values are compared with the cNSAF value of a key complex subunit (cNSAFKS). C, Association of SUDS3 and SAP30 with Halo-SIN3A or Halo-SIN3B. Lysates from HEK293T cells transiently transfected with plasmids expressing the indicated Halo tagged proteins were subjected to Halo affinity chromatography. Bound proteins were analyzed by SDS-PAGE followed by Western blotting using the antibodies indicated.
Fig. 6.
Fig. 6.
Sin3 interaction network is rewired after modifying protein complex purification strategy. The DyNet analysis tool (25) was used to compare two networks built from data from experiments using either transiently transfected cells (transient transfection network) or using cell lines stably expressing either Halo-SUDS3 or Halo-SAP30 (stable cell line network). Quantitative comparison of the networks was based on QSPEC values for log2FC for corresponding interactions in each of these networks. Pink edges indicate larger values of log2FC in the stable network, blue edges indicate larger values in the transient network; the width of the unbundled portion of each edge indicates the magnitude of Δlog2FC. Node color indicates the presence/absence of a prey protein—proteins depicted with red nodes are present in the stable cell line network only, with blue nodes in the transient transfection network only, and with white nodes in both networks. Diamond nodes indicate “core Sin3 subunits” (6, 29) and “other associated Sin3 proteins” (6). Hexagonal nodes indicate Sin3 associated transcription factors FOXK1, FOXK2 and BBX as well as other Sin3 components TNRC18 and BAHCC1, all described in Sardiu et al. (5).

References

    1. Hein M. Y., Hubner N. C., Poser I., Cox J., Nagaraj N., Toyoda Y., Gak I. A., Weisswange I., Mansfeld J., Buchholz F., Hyman A. A., and Mann M. (2015) A human interactome in three quantitative dimensions organized by stoichiometries and abundances. Cell 163, 712–723 - PubMed
    1. Huttlin E. L., Ting L., Bruckner R. J., Gebreab F., Gygi M. P., Szpyt J., Tam S., Zarraga G., Colby G., Baltier K., Dong R., Guarani V., Vaites L. P., Ordureau A., Rad R., Erickson B. K., Wühr M., Chick J., Zhai B., Kolippakkam D., Mintseris J., Obar R. A., Harris T., Artavanis-Tsakonas S., Sowa M. E., De Camilli P., Paulo J. A., Harper J. W., and Gygi S. P. (2015) The BioPlex network: a systematic exploration of the human interactome. Cell 162, 425–440 - PMC - PubMed
    1. Hubner N. C., Bird A. W., Cox J., Splettstoesser B., Bandilla P., Poser I., Hyman A., and Mann M. (2010) Quantitative proteomics combined with BAC TransgeneOmics reveals in vivo protein interactions. J. Cell Biol. 189, 739–754 - PMC - PubMed
    1. Banks C. A. S., Boanca G., Lee Z. T., Eubanks C. G., Hattem G. L., Peak A., Weems L. E., Conkright J. J., Florens L., and Washburn M. P. (2016) TNIP2 is a hub protein in the NF-κB network with both protein and RNA mediated interactions. Mol. Cell. Proteomics 15, 3435–3449 - PMC - PubMed
    1. Sardiu M. E., Smith K. T., Groppe B. D., Gilmore J. M., Saraf A., Egidy R., Peak A., Seidel C. W., Florens L., Workman J. L., and Washburn M. P. (2014) Suberoylanilide hydroxamic acid (SAHA)-induced dynamics of a human histone deacetylase protein interaction network. Mol. Cell. Proteomics 13, 3114–3125 - PMC - PubMed

Publication types

Substances

LinkOut - more resources