

Concentrations of Trace Elements and Clinical Outcomes in Hemodialysis Patients: A Prospective Cohort Study
- PMID: 29599300
- PMCID: PMC5989679
- DOI: 10.2215/CJN.11451017
Concentrations of Trace Elements and Clinical Outcomes in Hemodialysis Patients: A Prospective Cohort Study
Abstract
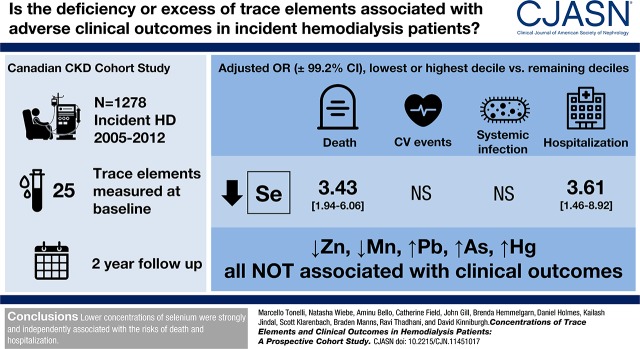
Background and objectives: Deficiency of essential trace elements and excess of potentially toxic trace elements are common in patients on hemodialysis. Whether these abnormalities are associated with poor outcomes is unknown but worth investigating, because they are potentially treatable.
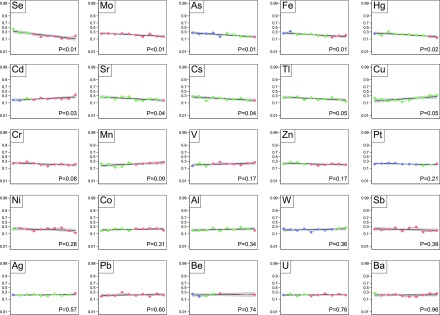
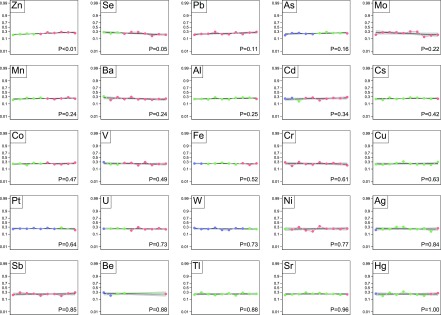
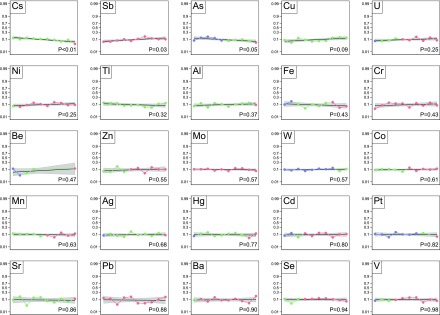
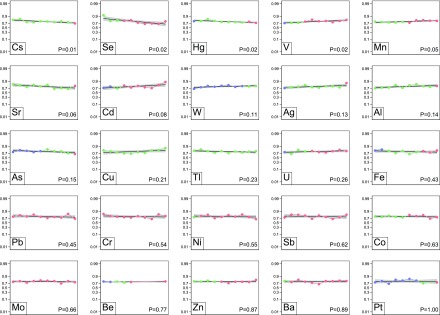
Design, setting, participants, & measurements: We did a prospective longitudinal study of 1278 patients on incident hemodialysis, assessing blood concentrations of 25 trace elements at baseline. We used adjusted logistic regression to evaluate the association between trace element status and four outcomes (death, cardiovascular events, systemic infection, and hospitalization). A priori hypotheses concerned (1) deficiency of zinc, selenium, and manganese and (2) excess of lead, arsenic, and mercury. Concentrations of the other 19 elements were tested in hypothesis-generating analyses.
Results: Over 2 years of follow-up, 260 (20%) patients died, 285 (24%) experienced a cardiovascular event, 117 (10%) were hospitalized for systemic infection, and 928 (77%) were hospitalized for any cause. Lower concentrations of zinc or manganese and higher concentrations of lead, arsenic, or mercury were not independently associated with higher risk of clinical outcomes. Lower concentrations of selenium were strongly and independently associated with death (odds ratio, 0.86 per decile; 99.2% confidence interval, 0.80 to 0.93) and all-cause hospitalization (odds ratio, 0.92 per decile; 99.2% confidence interval, 0.86 to 0.98). In exploratory analyses, higher copper concentrations were significantly associated with higher risk of death (odds ratio, 1.07 per decile; 99.2% confidence interval, 1.00 to 1.15), and cadmium levels in the highest decile were associated with higher risk of death (odds ratio, 1.89; 99.2% confidence interval, 1.06 to 3.38).
Conclusions: Lower levels of zinc or manganese and higher concentrations of lead, arsenic, or mercury were not associated with higher risk of clinical outcomes, but lower concentrations of selenium were strongly and independently associated with the risks of death and hospitalization.
Keywords: Arsenic; Cadmium; Copper; Follow-up Studies; Humans; Ions; Lead; Logistic Models; Longitudinal Studies; Manganese; Mercury; Prospective Studies; Selenium; Trace Elements; Zinc; hemodialysis; hospitalization; renal dialysis.
Copyright © 2018 by the American Society of Nephrology.
Figures
Similar articles
-
Concentrations of Trace Elements in Hemodialysis Patients: A Prospective Cohort Study.Am J Kidney Dis. 2017 Nov;70(5):696-704. doi: 10.1053/j.ajkd.2017.06.029. Epub 2017 Aug 31. Am J Kidney Dis. 2017. PMID: 28838766
-
Trace elements in the hair of hemodialysis patients.Biol Trace Elem Res. 2011 Nov;143(2):825-34. doi: 10.1007/s12011-010-8948-y. Epub 2011 Jan 14. Biol Trace Elem Res. 2011. PMID: 21234813
-
Variation of trace element concentrations in patients undergoing hemodialysis in the north of Spain.Scand J Clin Lab Invest. 2016 Oct;76(6):492-9. doi: 10.1080/00365513.2016.1201852. Epub 2016 Jun 30. Scand J Clin Lab Invest. 2016. PMID: 27362816
-
The role of environmental trace element toxicants on autism: A medical biogeochemistry perspective.Ecotoxicol Environ Saf. 2023 Feb;251:114561. doi: 10.1016/j.ecoenv.2023.114561. Epub 2023 Jan 23. Ecotoxicol Environ Saf. 2023. PMID: 36696851 Review.
-
Evaluation of dietary exposure to minerals, trace elements and heavy metals from the muscle tissue of the lionfish Pterois volitans (Linnaeus 1758).Food Chem Toxicol. 2013 Oct;60:205-12. doi: 10.1016/j.fct.2013.07.044. Epub 2013 Jul 26. Food Chem Toxicol. 2013. PMID: 23891700 Review.
Cited by
-
Micronutrient and Amino Acid Losses During Renal Replacement Therapy for Acute Kidney Injury.Kidney Int Rep. 2019 May 23;4(8):1094-1108. doi: 10.1016/j.ekir.2019.05.001. eCollection 2019 Aug. Kidney Int Rep. 2019. PMID: 31440700 Free PMC article.
-
Copper Serum Levels in the Hemodialysis Patient Population.Medicina (Kaunas). 2024 Sep 11;60(9):1484. doi: 10.3390/medicina60091484. Medicina (Kaunas). 2024. PMID: 39336525 Free PMC article. Review.
-
Micronutrients and Renal Outcomes: A Prospective Cohort Study.Nutrients. 2022 Jul 26;14(15):3063. doi: 10.3390/nu14153063. Nutrients. 2022. PMID: 35893916 Free PMC article.
-
Progress in the study of nutritional status and selenium in dialysis patients.Ann Med. 2023 Dec;55(1):2197296. doi: 10.1080/07853890.2023.2197296. Ann Med. 2023. PMID: 37038353 Free PMC article. Review.
-
The effectiveness of acceptance and commitment therapy on clinical symptoms and treatment adherence in dialysis patients.J Educ Health Promot. 2024 Feb 7;13:28. doi: 10.4103/jehp.jehp_1704_22. eCollection 2024. J Educ Health Promot. 2024. PMID: 38545310 Free PMC article.
References
-
- Rucker D, Thadhani R, Tonelli M: Trace element status in hemodialysis patients. Semin Dial 23: 389–395, 2010 - PubMed
-
- Wills MR, Savory J: Aluminum and chronic renal failure: Sources, absorption, transport, and toxicity. Crit Rev Clin Lab Sci 27: 59–107, 1989 - PubMed
-
- Kerr DN, Ward MK, Ellis HA, Simpson W, Parkinson IS: Aluminium intoxication in renal disease. Ciba Found Symp 169: 123–135, 1992 - PubMed
-
- Alfrey AC: Dialysis encephalopathy syndrome. Annu Rev Med 29: 93–98, 1978 - PubMed
-
- Altmann P, Al-Salihi F, Butter K, Cutler P, Blair J, Leeming R, Cunningham J, Marsh F: Serum aluminum levels and erythrocyte dihydropteridine reductase activity in patients on hemodialysis. N Engl J Med 317: 80–84, 1987 - PubMed
Publication types
MeSH terms
Substances
Grants and funding
LinkOut - more resources
Full Text Sources
Other Literature Sources
Medical
