. 2018 Jul 1;24(13):3137-3148.
doi: 10.1158/1078-0432.CCR-17-1957. Epub 2018 Mar 29.

Hyperpolarized [1-13C]-Pyruvate Magnetic Resonance Spectroscopic Imaging of Prostate Cancer In Vivo Predicts Efficacy of Targeting the Warburg Effect

Affiliations

Hyperpolarized [1-13C]-Pyruvate Magnetic Resonance Spectroscopic Imaging of Prostate Cancer In Vivo Predicts Efficacy of Targeting the Warburg Effect

Bradley T Scroggins et al. Clin Cancer Res. .

Abstract

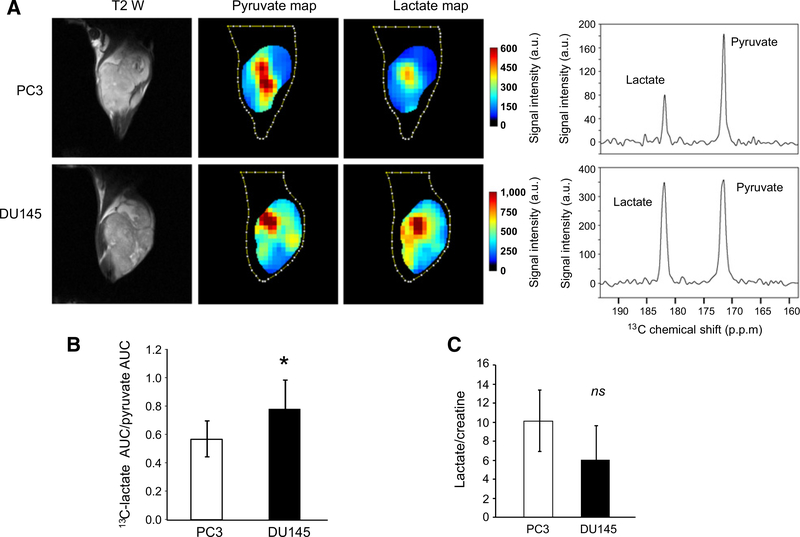
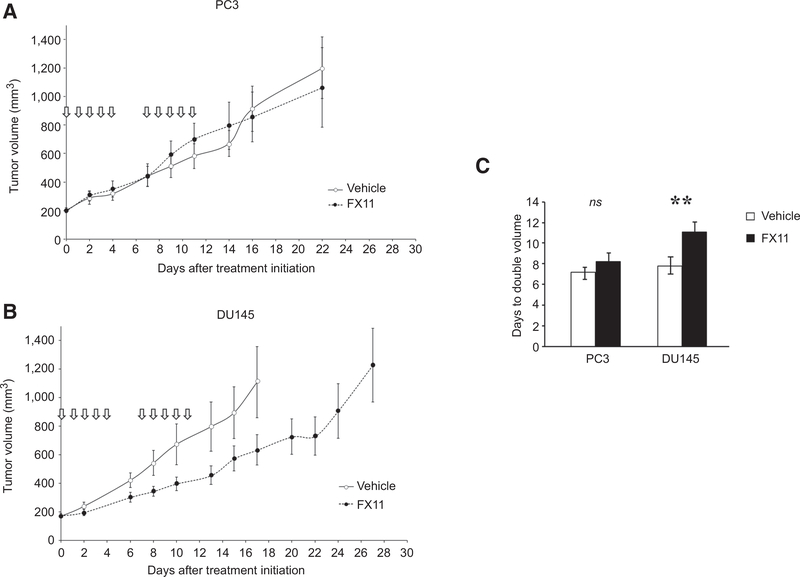
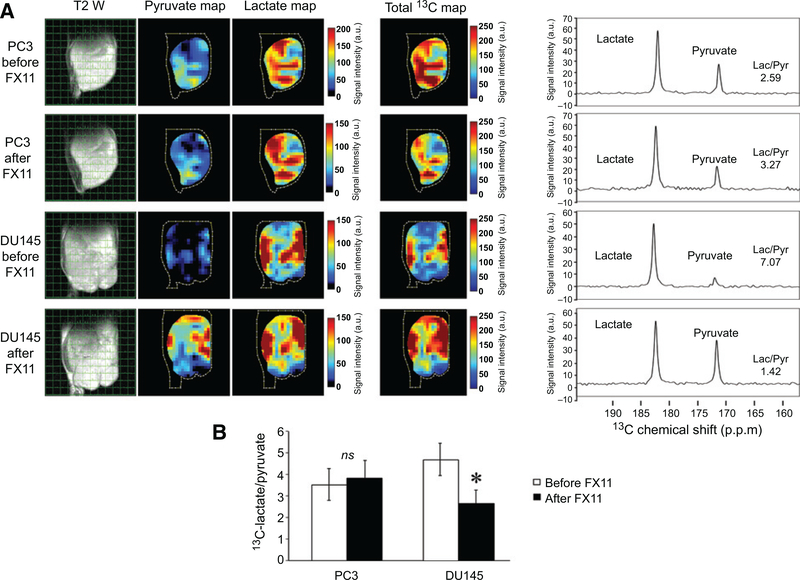
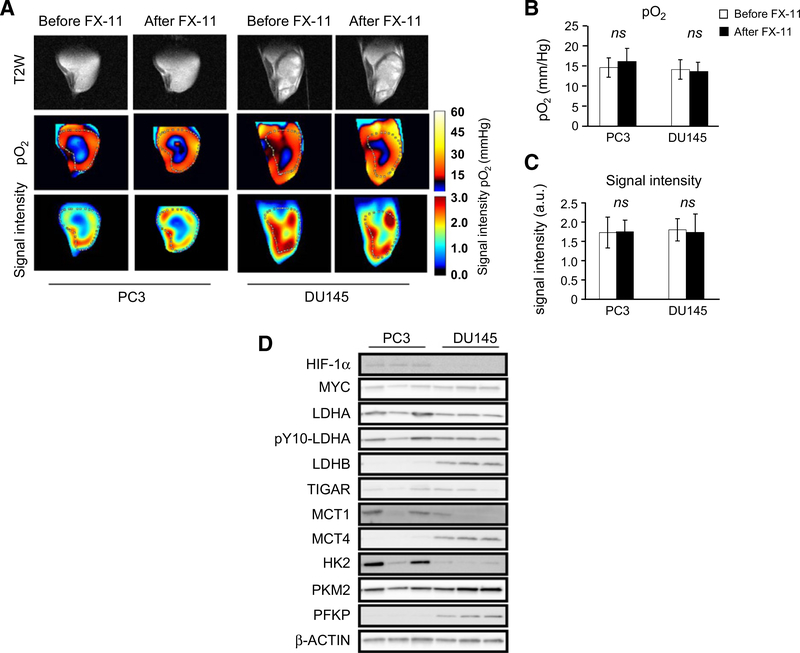
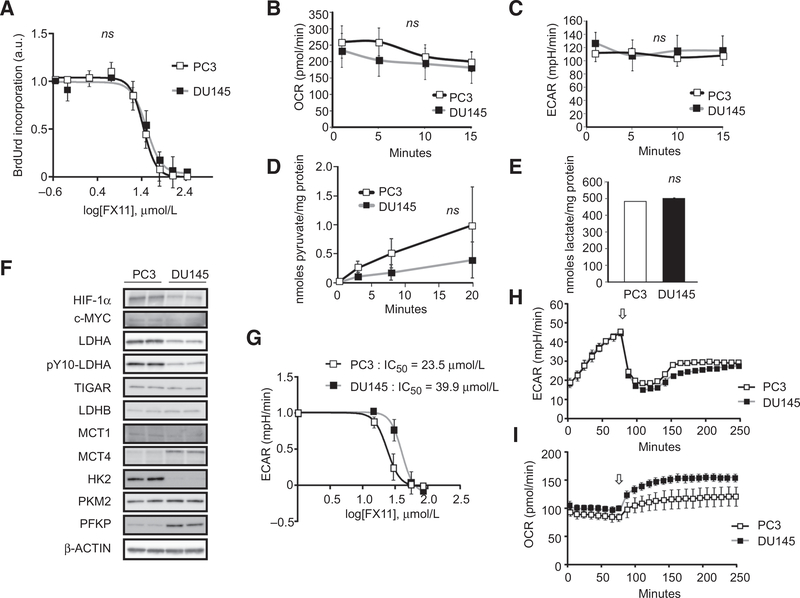
Purpose: To evaluate the potential of hyperpolarized [1-13C]-pyruvate magnetic resonance spectroscopic imaging (MRSI) of prostate cancer as a predictive biomarker for targeting the Warburg effect.Experimental Design: Two human prostate cancer cell lines (DU145 and PC3) were grown as xenografts. The conversion of pyruvate to lactate in xenografts was measured with hyperpolarized [1-13C]-pyruvate MRSI after systemic delivery of [1-13C] pyruvic acid. Steady-state metabolomic analysis of xenograft tumors was performed with mass spectrometry and steady-state lactate concentrations were measured with proton (1H) MRS. Perfusion and oxygenation of xenografts were measured with electron paramagnetic resonance (EPR) imaging with OX063. Tumor growth was assessed after lactate dehydrogenase (LDH) inhibition with FX-11 (42 μg/mouse/day for 5 days × 2 weekly cycles). Lactate production, pyruvate uptake, extracellular acidification rates, and oxygen consumption of the prostate cancer cell lines were analyzed in vitro LDH activity was assessed in tumor homogenates.Results: DU145 tumors demonstrated an enhanced conversion of pyruvate to lactate with hyperpolarized [1-13C]-pyruvate MRSI compared with PC3 and a corresponding greater sensitivity to LDH inhibition. No difference was observed between PC3 and DU145 xenografts in steady-state measures of pyruvate fermentation, oxygenation, or perfusion. The two cell lines exhibited similar sensitivity to FX-11 in vitro LDH activity correlated to FX-11 sensitivity.Conclusions: Hyperpolarized [1-13C]-pyruvate MRSI of prostate cancer predicts efficacy of targeting the Warburg effect. Clin Cancer Res; 24(13); 3137-48. ©2018 AACR.


Conflict of interest statement

Disclosure of Potential Conflicts of Interest

No potential conflicts of interest were disclosed.

Figures

Figure 1.
Figure 1.
Imaging lactate production in prostate cancer xenografts. PC3 and DU145 xenografts were grown in the hind leg of male athymic nu/nu mice. A, Axial T2-weighted images of representative xenografts with coordinating hyperpolarized 13C pyruvate and 13C lactate maps and corresponding spectra following the injection of hyperpolarized [1-13C] pyruvate. Lactate and pyruvate maps and spectra represent average time intensity between 12 and 90 seconds after the start of the scan (injection of hyperpolarized [1-13C] pyruvate at 10 seconds) in a representative tumor. The spectra demonstrate elevated levels of lactate in DU145 tumors compared with PC3 tumors. B, The ratio of the AUC of lactate to the AUC of pyruvate in DU145 and PC3 xenografts measured with hyperpolarized [1-13C] pyruvate MRSI (n = 5 mice per cell line). C, The ratio of lactate to creatine in DU145 and PC3 xenografts as measured by 1H-MRS. Bars, mean; error bars, SD; p.p.m., parts per million; *, P < 0.05 by paired t test; ns, not significant; P ≥ 0.05 by paired t test.
Figure 2.
Figure 2.
Effects of LDHA inhibition in prostate cancer xenografts. DU145 and PC3 cells were injected subcutaneously into the right hind leg of male athymic nu/nu mice. Mice were randomized to treatment with vehicle or FX-11 (42 μg/mouse/day for 5 days × 2 weekly cycles). Tumors were followed until they reached 1,000 mm3. The experiment was completed in triplicate. A and B, Representative growth curves. C, Tumor doubling time calculated from initiation of treatment including mice from triplicate experiments (n = 24 mice per treatment and condition). Bars, mean; error bars, standard error. *, P < 0.05 by ANOVA with Tukey correction; ns, not significant; P ≥ 0.05 by ANOVA with Tukey correction.
Figure 3.
Figure 3.
Effects of FX-11 on lactate production in prostate cancer xenografts. PC3 and DU145 xenografts were grown in the hind leg of male athymic nu/nu mice. Established tumors were imaged with hyperpolarized [1-13C] pyruvate MRSI immediately prior to the first treatment and 1 hour after the treatment with FX-11 (42 μg/mouse × 2 days). A, Axial T2-weighted image of PC3 and DU145 xenografts with coordinating hyperpolarized 13C pyruvate and 13C lactate maps and corresponding spectra following the injection of hyperpolarized [1-13C] pyruvate before and after treatment with FX-11. The spectra demonstrate elevated levels of lactate in the DU145 tumors compared with the PC3 tumors. DU145 tumors exhibited a substantial change in pyruvate conversion to lactate after FX-11 treatment that was not observed in PC3 tumors. B, The ratio of hyperpolarized 13C lactate to 13C pyruvate in DU145 and PC3 xenografts measured with hyperpolarized [1-13C] pyruvate MRSI (n = 5 mice per cell line and time point). Bars, mean; *, P < 0.05 by ANOVA with Tukey correction; ns, not significant; P ≥ 0.05 by ANOVA with Tukey correction.
Figure 4.
Figure 4.
Oxygenation and perfusion of DU145 and PC3 xenografts. PC3 and DU145 xenografts were grown in the hind leg of male athymic nu/nu mice. At approximately 1,000 mm3 volume, tumors were imaged with EPR imaging 3 to 15 minutes after intravenous delivery of OXO63. A, Representative T2 anatomic images of DU145 and PC3 xenografts with coregistered EPR imaging (signal intensity and pO2) before and after FX-11. Oxygenation within DU145 and PC3 xenografts as assessed by EPR imaging before and after FX-11 treatment. Perfusion was assessed by determining the signal intensity within imaged tumors. B, Median oxygenation within DU145 and PC3 xenografts as assessed by EPR imaging before and after FX-11 treatment (n = 5 mice per cell line and time point). C, Median signal intensity in DU145 and PC3 tumors before and after treatment with FX-11 (42 μg/mouse × 2 days). D, PC3 and DU145 xenografts were grown in the hind leg of male athymic nu/nu mice. At approximately 1,000 mm3 volume, untreated tumors were harvested and probed with Western blot analysis of the indicated proteins using β-actin as the loading control. Bars, mean; error bars, SD. ns, not significant; P ≥ 0.05 by ANOVA with Tukey correction.
Figure 5.
Figure 5.
In vitro analysis of the glycolytic state of DU145 and PC3 cell lines. Exponentially growing DU145 and PC3 tumor cells were utilized. A, Cells were exposed to varying concentrations of FX-11, and BrdU uptake was analyzed at 24 hours. B and C, Plated cells were incubated with XF assay medium, and OCR and ECAR were measured. D, Uptake of [2-14C] pyruvic acid in DU145 and PC3 cells over 20 minutes was determined by assessing cell lysates using a scintillation counter and normalized to protein concentrations. E, Lactate content of exponentially growing tumor cells was measured and normalized to total protein. F, Exponentially growing untreated DU145 and PC3 cells were collected. The expression of the indicated proteins was determined with Western blotting of cell lysates using β-actin as the loading control. G, Cells were exposed to varying concentrations of FX-11, and ECAR was assessed at 140 minutes after FX-11 treatment. H and I, Plated cells were incubated with XF assay medium and treated at the indicated time point (arrow) with pyruvate (8.35 mmol/L) and OCR and ECAR were measured. Bars and points, mean; error bars, SD; ns, not significant; P ≥ 0.05 by paired t test.

References

    1. Siegel RL, Miller KD, Jemal A. Cancer statistics, 2017. CA Cancer J Clin 2017;67:7–30. - PubMed
    1. Warburg O On the origin of cancer cells. Science 1956;123:309–14. - PubMed
    1. Estrella V, Chen T, Lloyd M, Wojtkowiak J, Cornnell HH, Ibrahim-Hashim A, et al. Acidity generated by the tumor microenvironment drives local invasion. Cancer Res 2013;73:1524–35. - PMC - PubMed
    1. Chang CH, Qiu J, O’Sullivan D, Buck MD, Noguchi T, Curtis JD, et al. Metabolic competition in the tumor microenvironment is a driver of cancer progression. Cell 2015;162:1229–41. - PMC - PubMed
    1. Zheng J Energy metabolism of cancer: Glycolysis versus oxidative phosphorylation (Review). Oncol Lett 2012;4:1151–7. - PMC - PubMed

Publication types

MeSH terms