

Brown adipose tissue whitening leads to brown adipocyte death and adipose tissue inflammation
- PMID: 29599420
- PMCID: PMC5928436
- DOI: 10.1194/jlr.M079665
Brown adipose tissue whitening leads to brown adipocyte death and adipose tissue inflammation
Abstract
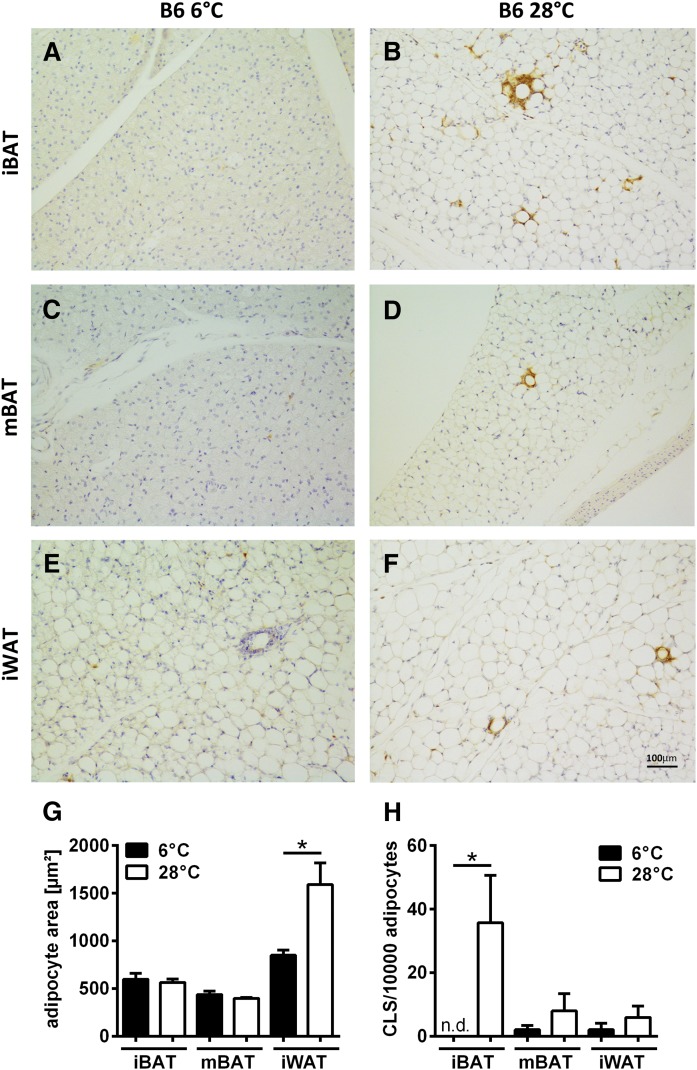
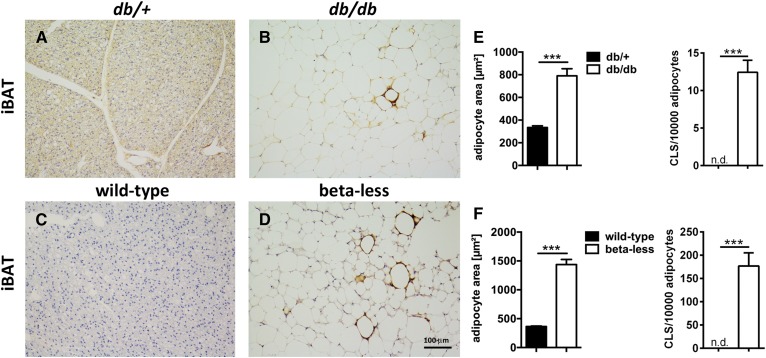
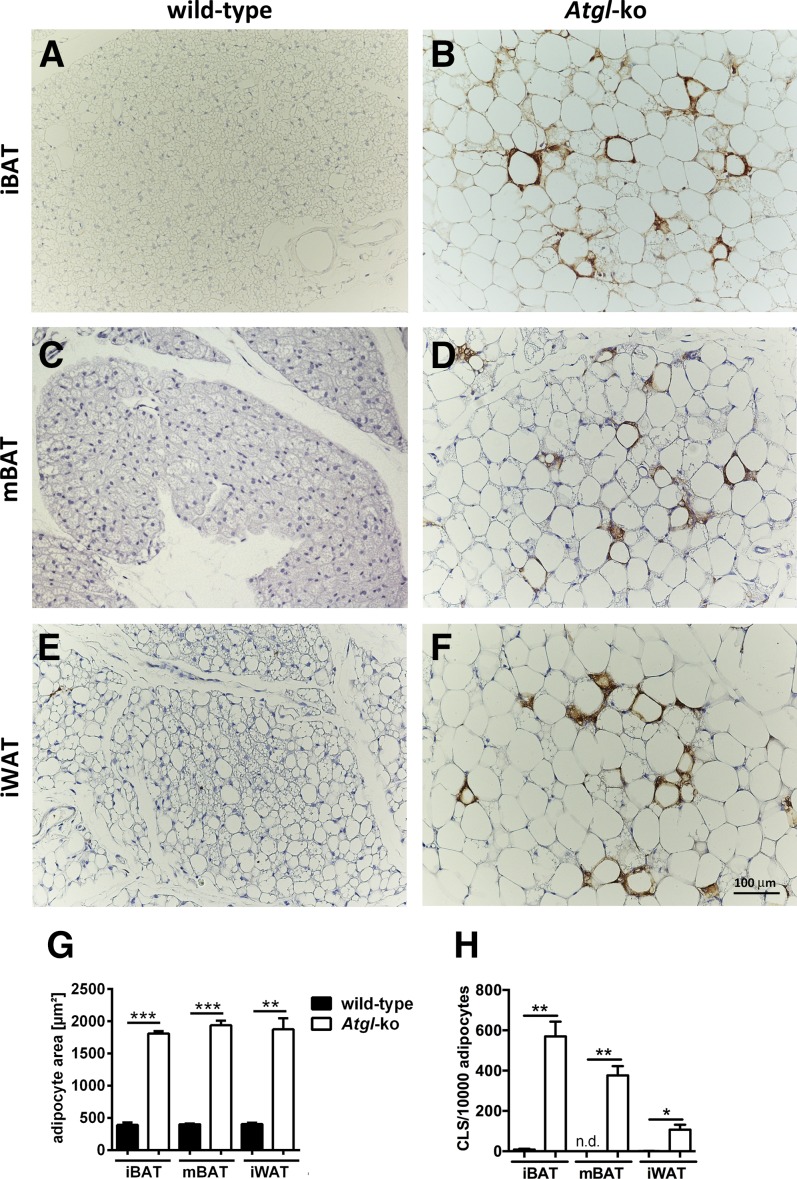
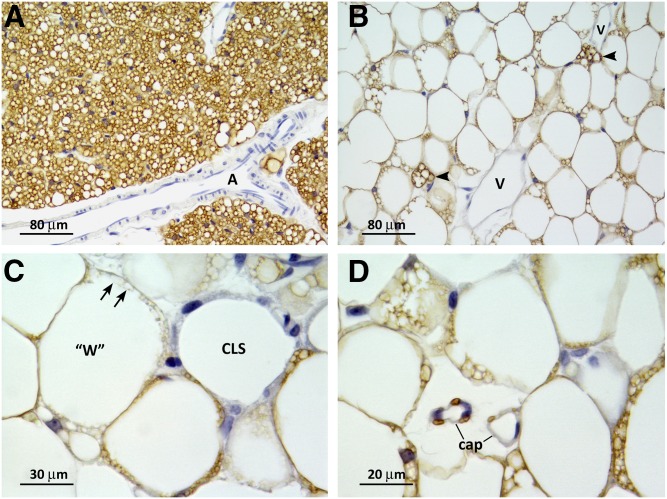
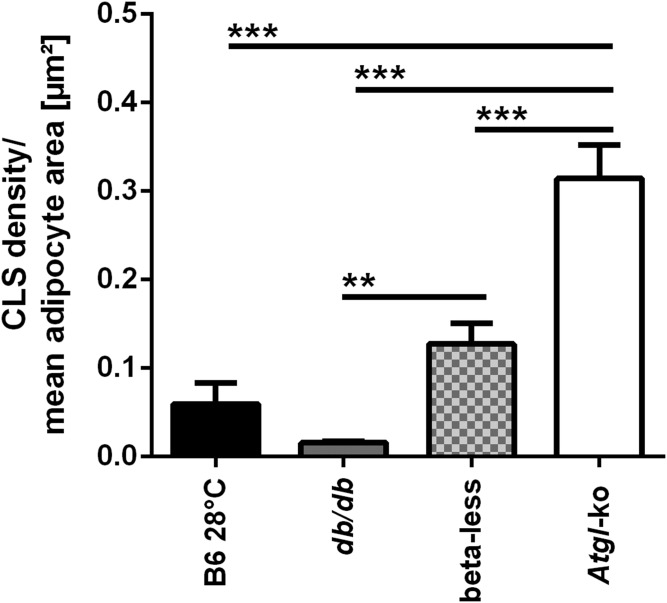
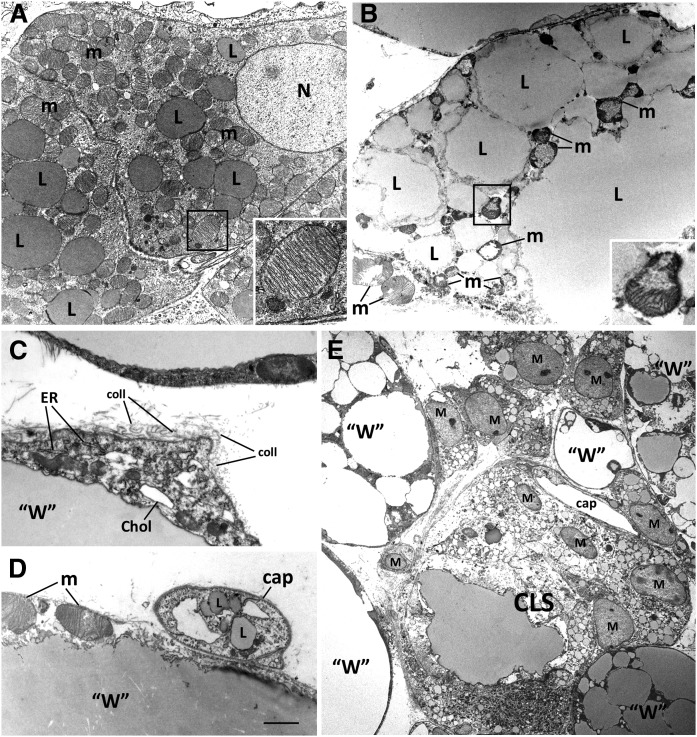
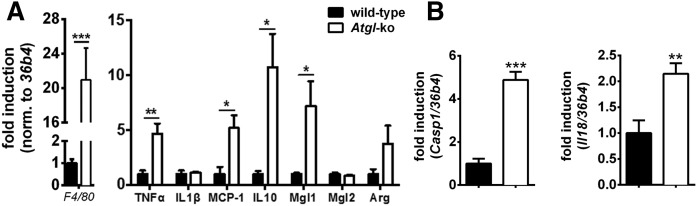
In mammals, white adipose tissue (WAT) stores and releases lipids, whereas brown adipose tissue (BAT) oxidizes lipids to fuel thermogenesis. In obese individuals, WAT undergoes profound changes; it expands, becomes dysfunctional, and develops a low-grade inflammatory state. Importantly, BAT content and activity decline in obese subjects, mainly as a result of the conversion of brown adipocytes to white-like unilocular cells. Here, we show that BAT "whitening" is induced by multiple factors, including high ambient temperature, leptin receptor deficiency, β-adrenergic signaling impairment, and lipase deficiency, each of which is capable of inducing macrophage infiltration, brown adipocyte death, and crown-like structure (CLS) formation. Brown-to-white conversion and increased CLS formation were most marked in BAT from adipose triglyceride lipase (Atgl)-deficient mice, where, according to transmission electron microscopy, whitened brown adipocytes contained enlarged endoplasmic reticulum, cholesterol crystals, and some degenerating mitochondria, and were surrounded by an increased number of collagen fibrils. Gene expression analysis showed that BAT whitening in Atgl-deficient mice was associated to a strong inflammatory response and NLRP3 inflammasome activation. Altogether, the present findings suggest that converted enlarged brown adipocytes are highly prone to death, which, by promoting inflammation in whitened BAT, may contribute to the typical inflammatory state seen in obesity.
Keywords: adipocyte size; adipose triglyceride lipase; brown fat; macrophage; nucleotide-binding oligomerization domain-like receptor-3 inflammasome; white adipocyte; white adipose tissue.
Copyright © 2018 by the American Society for Biochemistry and Molecular Biology, Inc.
Figures

Similar articles
-
Lipolysis Triggers a Systemic Insulin Response Essential for Efficient Energy Replenishment of Activated Brown Adipose Tissue in Mice.Cell Metab. 2018 Oct 2;28(4):644-655.e4. doi: 10.1016/j.cmet.2018.06.020. Epub 2018 Jul 19. Cell Metab. 2018. PMID: 30033199
-
Comparison of brown and white adipose tissue fat fractions in ob, seipin, and Fsp27 gene knockout mice by chemical shift-selective imaging and (1)H-MR spectroscopy.Am J Physiol Endocrinol Metab. 2013 Jan 15;304(2):E160-7. doi: 10.1152/ajpendo.00401.2012. Epub 2012 Nov 13. Am J Physiol Endocrinol Metab. 2013. PMID: 23149622
-
A polyphenolic extract from green tea leaves activates fat browning in high-fat-diet-induced obese mice.J Nutr Biochem. 2017 Nov;49:15-21. doi: 10.1016/j.jnutbio.2017.07.008. Epub 2017 Jul 24. J Nutr Biochem. 2017. PMID: 28863365
-
CIDE Family-Mediated Unique Lipid Droplet Morphology in White Adipose Tissue and Brown Adipose Tissue Determines the Adipocyte Energy Metabolism.J Atheroscler Thromb. 2017 Oct 1;24(10):989-998. doi: 10.5551/jat.RV17011. Epub 2017 Sep 5. J Atheroscler Thromb. 2017. PMID: 28883211 Free PMC article. Review.
-
Potential of Nutraceutical Supplementation in the Modulation of White and Brown Fat Tissues in Obesity-Associated Disorders: Role of Inflammatory Signalling.Int J Mol Sci. 2021 Mar 25;22(7):3351. doi: 10.3390/ijms22073351. Int J Mol Sci. 2021. PMID: 33805912 Free PMC article. Review.
Cited by
-
The Importance of Breast Adipose Tissue in Breast Cancer.Int J Mol Sci. 2020 Aug 11;21(16):5760. doi: 10.3390/ijms21165760. Int J Mol Sci. 2020. PMID: 32796696 Free PMC article. Review.
-
Dysregulation of mitochondrial dynamics mediated aortic perivascular adipose tissue-associated vascular reactivity impairment under excessive fructose intake.Nutr Metab (Lond). 2024 Jan 2;21(1):4. doi: 10.1186/s12986-023-00776-7. Nutr Metab (Lond). 2024. PMID: 38167066 Free PMC article.
-
Adipose tissue-specific ablation of PGC-1β impairs thermogenesis in brown fat.Dis Model Mech. 2022 Apr 1;15(4):dmm049223. doi: 10.1242/dmm.049223. Epub 2022 Apr 25. Dis Model Mech. 2022. PMID: 35466996 Free PMC article.
-
CircRNA-mediated regulation of brown adipose tissue adipogenesis.Front Nutr. 2022 Jul 29;9:926024. doi: 10.3389/fnut.2022.926024. eCollection 2022. Front Nutr. 2022. PMID: 35967789 Free PMC article.
-
Understanding the Roles of Selenium on Thyroid Hormone-Induced Thermogenesis in Adipose Tissue.Biol Trace Elem Res. 2024 Jun;202(6):2419-2441. doi: 10.1007/s12011-023-03854-2. Epub 2023 Sep 27. Biol Trace Elem Res. 2024. PMID: 37758980 Review.
References
-
- Klöting N., Fasshauer M., Dietrich A., Kovacs P., Schön M. R., Kern M., Stumvoll M., and Blüher M.. 2010. Insulin-sensitive obesity. Am. J. Physiol. Endocrinol. Metab. 299: E506–E515. - PubMed
-
- Centers for Disease Control and Prevention. 2011. National diabetes fact sheet: national estimates and general information on diabetes and prediabetes in the United States, 2011. Atlanta (GA): US Department of Health and Human Services, Centers for Disease Control and Prevention.
Publication types
MeSH terms
Substances
Grants and funding
LinkOut - more resources
Full Text Sources
Other Literature Sources
Molecular Biology Databases
