. 2018 Mar 29;9(1):1280.
doi: 10.1038/s41467-018-03633-x.

RodZ modulates geometric localization of the bacterial actin MreB to regulate cell shape

Affiliations

RodZ modulates geometric localization of the bacterial actin MreB to regulate cell shape

Alexandre Colavin et al. Nat Commun. .

Abstract

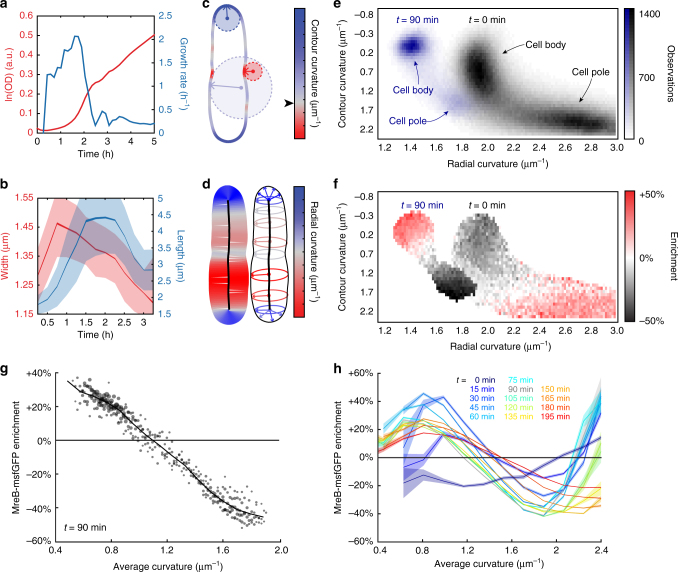
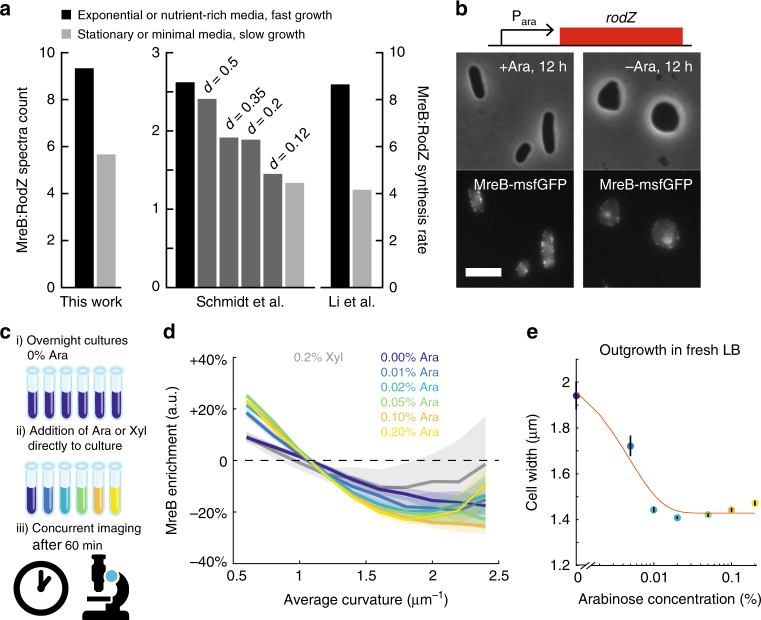
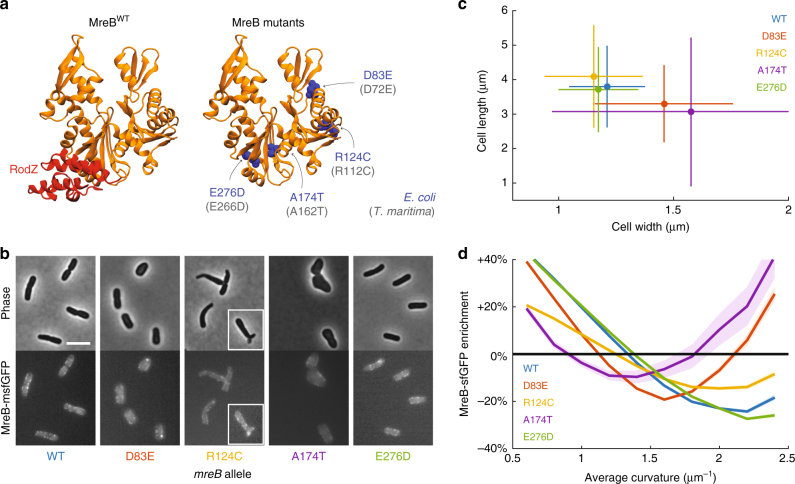
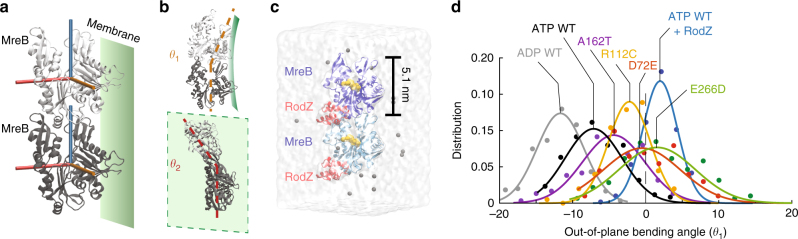
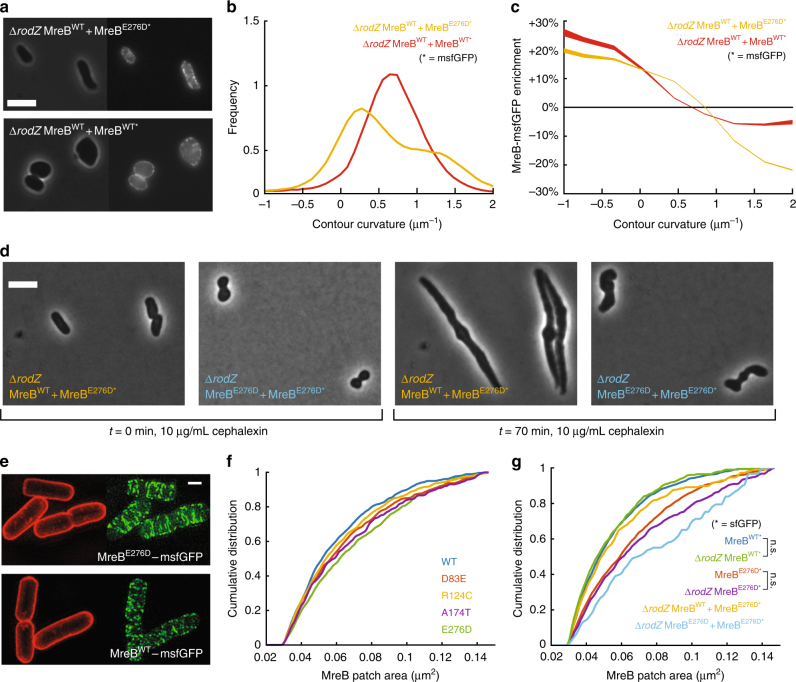
In the rod-shaped bacterium Escherichia coli, the actin-like protein MreB localizes in a curvature-dependent manner and spatially coordinates cell-wall insertion to maintain cell shape, although the molecular mechanism by which cell width is regulated remains unknown. Here we demonstrate that the membrane protein RodZ regulates the biophysical properties of MreB and alters the spatial organization of E. coli cell-wall growth. The relative expression levels of MreB and RodZ change in a manner commensurate with variations in growth rate and cell width, and RodZ systematically alters the curvature-based localization of MreB and cell width in a concentration-dependent manner. We identify MreB mutants that alter the bending properties of MreB filaments in molecular dynamics simulations similar to RodZ binding, and show that these mutants rescue rod-like shape in the absence of RodZ alone or in combination with wild-type MreB. Thus, E. coli can control its shape and dimensions by differentially regulating RodZ and MreB to alter the patterning of cell-wall insertion, highlighting the rich regulatory landscape of cytoskeletal molecular biophysics.


Conflict of interest statement

The authors declare no competing interests.

Figures

Fig. 1
Fig. 1
Cell shape and MreB localization patterns change as cell density increases in a growing culture. a The population density and growth rate of E. coli cells growing in fresh LB were estimated from optical density (OD) measurements. b Mean cell width and length across the population varied rapidly and asynchronously during the time course. Shaded areas represent standard deviation at each time point, whereas the variable thickness of the solid line represents the standard error at each time point (n > 800 cells). c, d The local geometry of every point on each cell’s contour was characterized by the in-plane contour curvature (c) and perpendicular radial curvature (d). c The red circle represents a point of negative contour curvature at the division site, the small blue circle represents a point of highly positive contour curvature at the pole, and the large blue circle represents a region of slightly positive contour curvature along the lateral wall. The black arrowhead next to the colormap in c demarcates zero contour curvature, corresponding to flat regions. d The radial curvature is inversely related to the local width of the cell. e The frequency of pairs of contour and radial curvature values sampled by a population of E. coli cells after 0 min and 90 min of growth illustrates the range of curvature values across their surfaces. Each bin is 0.0821 μm−1 (contour curvature) by 0.0165 μm−1 (radial curvature). Black: t = 0, blue: t = 90 min. f Enrichment of MreB fluorescence at t = 90 min observed for each bin in e with more than 50 observations demonstrates that MreB localization depends on both contour curvature and radial curvature. g Each circle represents the MreB-msfGFP enrichment for the estimated average curvature of a bin in f (corresponding to data from t = 90 min), which was defined as the average of contour and radial curvatures for that bin. The radius of each circle is linear with the log number of observations for the respective bin in e. The weighted average across bins with a given average curvature is shown as a solid line. h The enrichment of MreB-msfGFP varied substantially across the growth curve. Shaded areas represent the standard deviation of enrichment from resampled data at each time point (Methods section). All bins include at least 50 observations
Fig. 2
Fig. 2
RodZ expression drives changes in MreB curvature enrichment profile. a The ratio of MreB to RodZ protein abundance consistently increases in a manner concordant with growth rate across multiple independent studies. d: chemostat dilution rate. b For a strain in which the native promoter of rodZ was replaced by Para, RodZ expression is driven by arabinose (Ara). In the absence of arabinose, cells became spheroidal. Scale bar is 5 µm. c Schematic of experimental approach in d. Overnight cultures grown in the absence of arabinose were further incubated after adding varying amounts of arabinose. The distribution of MreB fluorescence was measured after 60 min. d After 1 h of growth, induction of RodZ by arabinose enhanced the depletion of MreB at high-average curvature in a dose-dependent manner. By contrast, the enrichment profile was more uniform after induction with 0.2% xylose (Xyl) or 0% arabinose. Shaded areas represent the standard deviation of enrichment from resampled data for each condition. All bins include at least 50 observations. e Overnight cultures grown in 0% arabinose and back-diluted 1:10,000 into fresh LB with varying levels of arabinose exhibited dose-dependent steady-state widths after 4 h of growth. Black lines represent standard error of mean (n > 50 cells)
Fig. 3
Fig. 3
Genetic perturbations that alter the MreB curvature enrichment profile. a RodZ binds near the polymerization interface in domain IIA of MreB (left). Mutations in MreB previously identified to suppress ∆rodZ growth defects (D83E, R124C, and A174T), as well as a mutation at the polymerization interface (E276D), are spread throughout the protein and are conserved in T. maritima MreB (gray text in parentheses; right). b MreB mutants (all as sandwich fusions to msfGFP) have a variety of cell shapes, including wider cells (MreBD83E), tapered and sometimes branched cells (MreBR124C; white box highlights a branched cell), much wider and rounder cells (MreBA174T), and wild-type-like cells (MreBE276D). Scale bar is 5 µm. c, d Strains that harbor mutations in MreB that suppress ∆rodZ growth defects have altered cellular dimensions (c) and MreB curvature enrichment profiles (d) relative to wild type, whereas MreBE276D cells are similar to wild type. Error bars in c represent standard deviation of populations with n > 230 cells. All bins in d include at least 50 observations, and shaded areas represent standard deviation of enrichment from resampled data for each strain
Fig. 4
Fig. 4
RodZ binding and MreB mutations may alter the bending properties of MreB filaments. a Schematic of an MreB dimer (PDB ID: 1JCG) and its orientation relative to the membrane. The bending of MreB protofilaments is captured by the relative orientation along three orthogonal axes (cylinders) of adjacent MreB subunits, colored light (top) and dark gray (bottom). The membrane binding interface of the MreB protofilament is shown as a green plane. b Schematic of MreB dimer bending angles out of the plane of the membrane (θ1, top) and in the plane of the membrane (θ2, bottom). In the crystal structures that form the initial states of our MD simulations, these bending angles are zero. c MD simulation system comprised of a nucleotide-bound T. maritima MreB dimer, with each subunit bound to the cytoplasmic tail of RodZ. d D72E, R112C, A162T, and E266D mutations in ATP-bound T. maritima MreB shift the θ1 bending angles toward that of a RodZ-bound ATP dimer, signifying filament straightening
Fig. 5
Fig. 5
Concurrent expression of MreBE276D-msfGFP and MreBWT recovers rod shape in ∆rodZ cells. a Rod shape was rescued in ∆rodZ cells with chromosomal expression of MreBWT by introducing a plasmid-borne copy of MreBE276D-msfGFP (top), but not with a plasmid-borne copy of MreBWT-msfGFP (bottom). Scale bar is 5 µm. brodZ MreBWT + MreBE276D* cells exhibited a bimodal contour curvature distribution with one peak centered near zero, characteristic of rod-shaped cells, unlike the unimodal distribution of ∆rodZ MreBWT + MreBWT* cells. crodZ MreBWT + MreBE276D* cells exhibited enhanced depletion of MreBE276D-msfGFP at high-contour curvature as compared with MreBWT-msfGFP in ∆rodZ MreBWT + MreBWT* cells. The variable thickness of the solid line represents the standard error at each time point. d When division was inhibited by cephalexin (10 µg/mL), most (80%) ∆rodZ MreBWT + MreBE276D* cells maintained a rod-like shape after doubling in length, while only 50% of ∆rodZ MreBE276D + MreBE276D* cells elongated by twofold in 70 min . Snapshots of cells shown before (left) and after (right) 70 min of cephalexin treatment. Scale bar is 5 µm. e Structured illumination microscopy revealed that the MreBE276D-msfGFP mutant strain had qualitatively longer filaments than the strain harboring MreBWT-msfGFP. Red fluorescence represents FM 4-64FX membrane staining. Scale bar is 1 µm. f The cumulative distributions of MreB-msfGFP fluorescence patch sizes for ∆rodZ suppressor MreB mutants were intermediate between those of MreBWT and MreBE276D. Each MreB patch was defined as a continuous region larger than the diffraction limit with high-GFP signal located within the cell contour. n > 50 single cells were analyzed for each strain. g Patch sizes for varied widely across strains, as indicated by the cumulative distribution of MreB-msfGFP fluorescence. Strains containing MreBE276D-msfGFP consistently showed distributions indicative of larger patch sizes (p < 10−18, t-test). Deletion of RodZ alone did not lead to statistically significant differences in the distribution of MreB patch sizes. n > 50 single cells were analyzed for each strain

Similar articles

Cited by

References

    1. Scheffers DJ, Pinho MG. Bacterial cell wall synthesis: new insights from localization studies. Microbiol. Mol. Biol. Rev. 2005;69:585–607. doi: 10.1128/MMBR.69.4.585-607.2005. - DOI - PMC - PubMed
    1. Höltje JV. Growth of the stress-bearing and shape-maintaining murein sacculus of Escherichia coli. Microbiol. Mol. Biol. Rev. 1998;62:181–203. - PMC - PubMed
    1. Tropini C, et al. Principles of bacterial cell-size determination revealed by cell-wall synthesis perturbations. Cell Rep. 2014;9:1–8. doi: 10.1016/j.celrep.2014.10.027. - DOI - PMC - PubMed
    1. Wang S, Furchtgott L, Huang KC, Shaevitz JW. Helical insertion of peptidoglycan produces chiral ordering of the bacterial cell wall. Proc. Natl Acad. Sci. USA. 2012;109:E595–E604. doi: 10.1073/pnas.1117132109. - DOI - PMC - PubMed
    1. van den Ent F, La Amos, Löwe J. Prokaryotic origin of the actin cytoskeleton. Nature. 2001;413:39–44. doi: 10.1038/35092500. - DOI - PubMed

Publication types

MeSH terms

LinkOut - more resources