

Comprehensive characterization of glutamine synthetase-mediated selection for the establishment of recombinant CHO cells producing monoclonal antibodies
- PMID: 29599455
- PMCID: PMC5876325
- DOI: 10.1038/s41598-018-23720-9
Comprehensive characterization of glutamine synthetase-mediated selection for the establishment of recombinant CHO cells producing monoclonal antibodies
Abstract
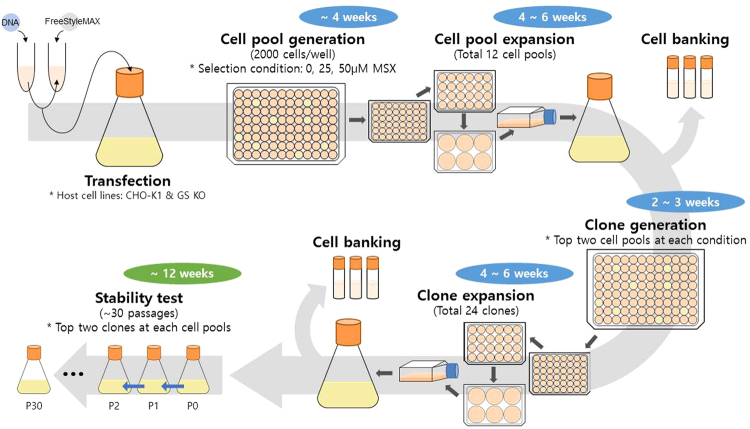
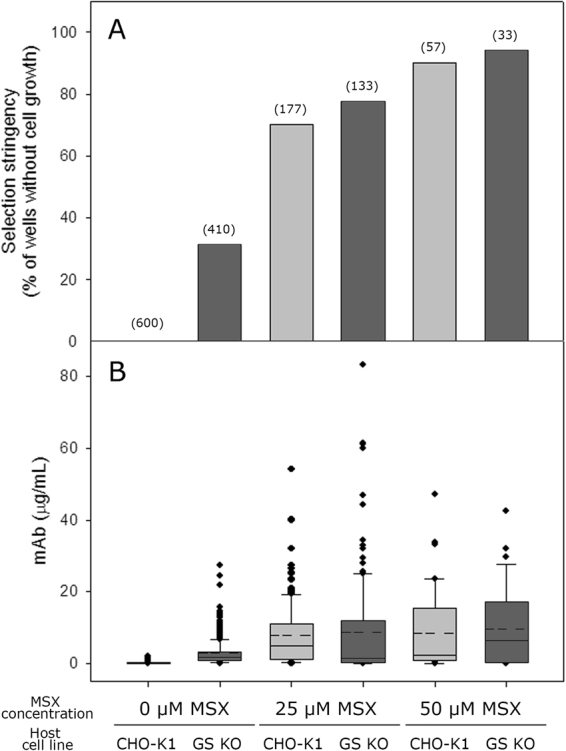
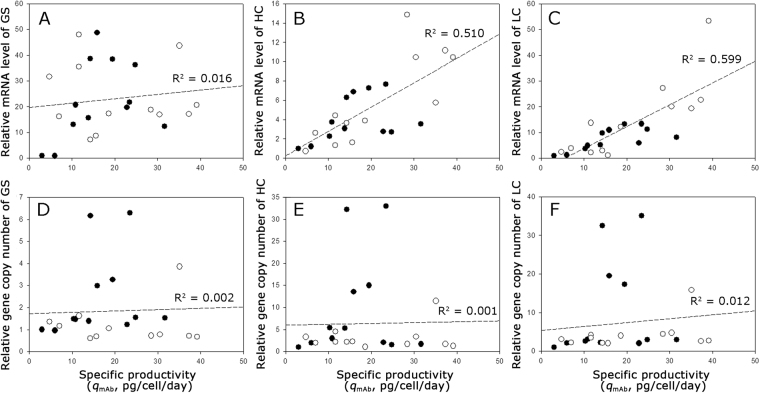
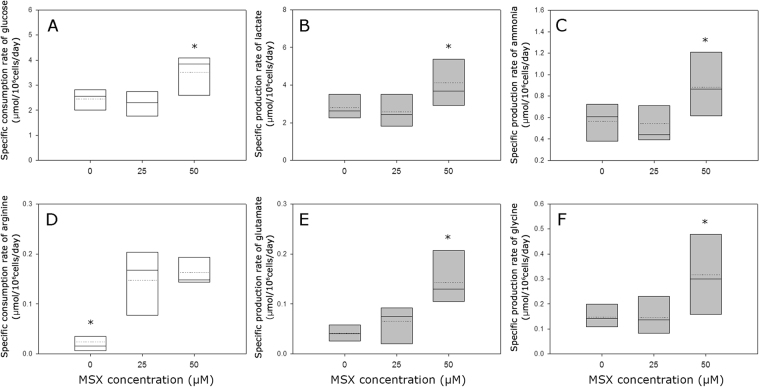
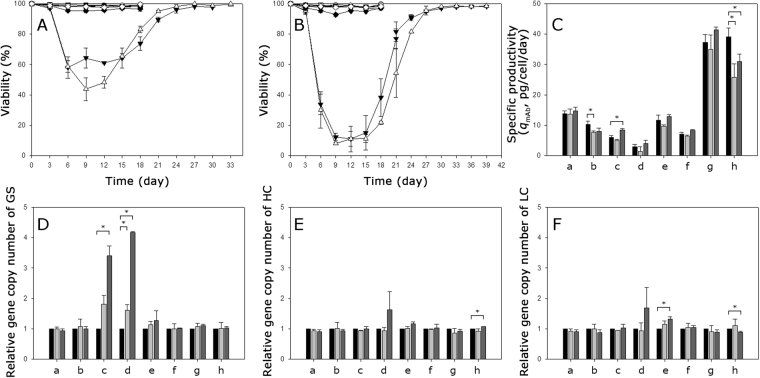
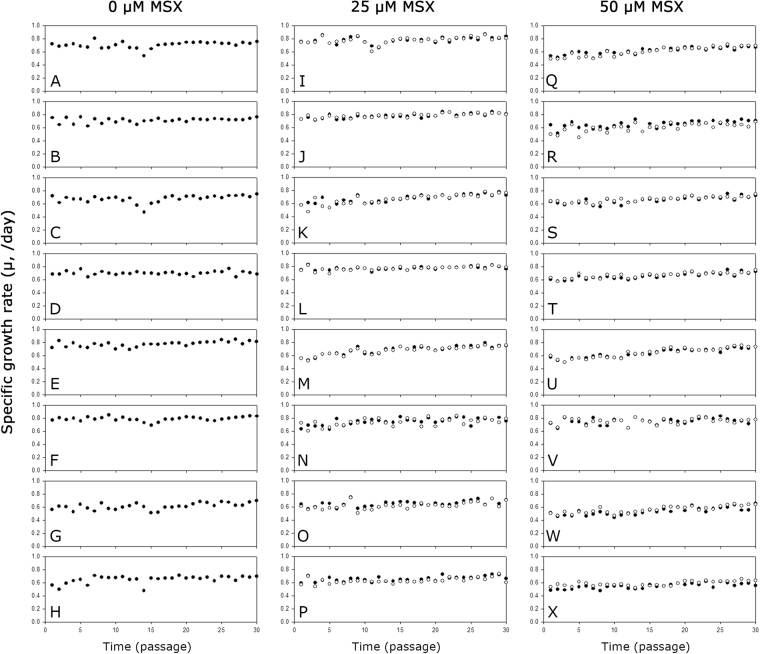
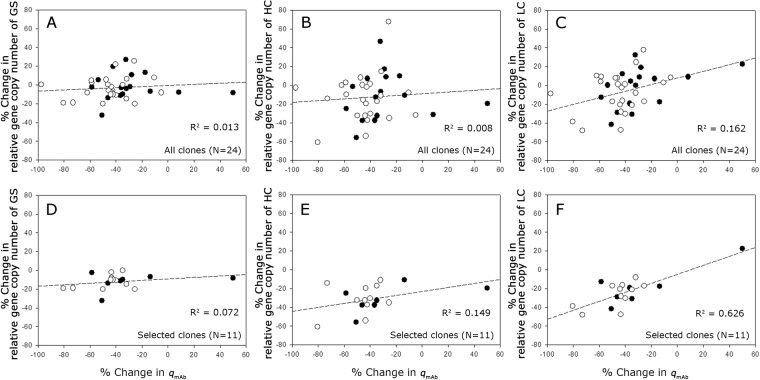
To characterize a glutamine synthetase (GS)-based selection system, monoclonal antibody (mAb) producing recombinant CHO cell clones were generated by a single round of selection at various methionine sulfoximine (MSX) concentrations (0, 25, and 50 μM) using two different host cell lines (CHO-K1 and GS-knockout CHO). Regardless of the host cell lines used, the clones selected at 50 μM MSX had the lowest average specific growth rate and the highest average specific production rates of toxic metabolic wastes, lactate and ammonia. Unlike CHO-K1, high producing clones could be generated in the absence of MSX using GS-knockout CHO with an improved selection stringency. Regardless of the host cell lines used, the clones selected at various MSX concentrations showed no significant difference in the GS, heavy chain, and light chain gene copies (P > 0.05). Furthermore, there was no correlation between the specific mAb productivity and these three gene copies (R2 ≤ 0.012). Taken together, GS-mediated gene amplification does not occur in a single round of selection at a MSX concentration up to 50 μM. The use of the GS-knockout CHO host cell line facilitates the rapid generation of high producing clones with reduced production of lactate and ammonia in the absence of MSX.
Conflict of interest statement
The authors declare no competing interests.
Figures

Similar articles
-
Improving the efficiency of CHO cell line generation using glutamine synthetase gene knockout cells.Biotechnol Bioeng. 2012 Apr;109(4):1007-15. doi: 10.1002/bit.24365. Epub 2011 Nov 21. Biotechnol Bioeng. 2012. PMID: 22068567
-
Reduction of ammonia and lactate through the coupling of glutamine synthetase selection and downregulation of lactate dehydrogenase-A in CHO cells.Appl Microbiol Biotechnol. 2017 Feb;101(3):1035-1045. doi: 10.1007/s00253-016-7876-y. Epub 2016 Oct 4. Appl Microbiol Biotechnol. 2017. PMID: 27704181
-
Attenuated glutamine synthetase as a selection marker in CHO cells to efficiently isolate highly productive stable cells for the production of antibodies and other biologics.MAbs. 2019 Jul;11(5):965-976. doi: 10.1080/19420862.2019.1612690. Epub 2019 Jun 4. MAbs. 2019. PMID: 31043114 Free PMC article.
-
Methionine sulfoximine supplementation enhances productivity in GS-CHOK1SV cell lines through glutathione biosynthesis.Biotechnol Prog. 2017 Jan;33(1):17-25. doi: 10.1002/btpr.2372. Epub 2016 Oct 31. Biotechnol Prog. 2017. PMID: 27689785
-
Recombinant Antibody Production in CHO and NS0 Cells: Differences and Similarities.BioDrugs. 2018 Dec;32(6):571-584. doi: 10.1007/s40259-018-0319-9. BioDrugs. 2018. PMID: 30499081 Review.
Cited by
-
Increased mAb production in amplified CHO cell lines is associated with increased interaction of CREB1 with transgene promoter.Curr Res Biotechnol. 2019 Nov;1:49-57. doi: 10.1016/j.crbiot.2019.09.001. Epub 2019 Oct 5. Curr Res Biotechnol. 2019. PMID: 32577618 Free PMC article.
-
The shortcomings of accurate rate estimations in cultivation processes and a solution for precise and robust process modeling.Bioprocess Biosyst Eng. 2020 Feb;43(2):169-178. doi: 10.1007/s00449-019-02214-6. Epub 2019 Sep 20. Bioprocess Biosyst Eng. 2020. PMID: 31541314 Free PMC article.
-
Building blocks needed for mechanistic modeling of bioprocesses: A critical review based on protein production by CHO cells.Metab Eng Commun. 2024 Feb 29;18:e00232. doi: 10.1016/j.mec.2024.e00232. eCollection 2024 Jun. Metab Eng Commun. 2024. PMID: 38501051 Free PMC article. Review.
-
Application of CRISPR/Cas9 Genome Editing to Improve Recombinant Protein Production in CHO Cells.Methods Mol Biol. 2025;2853:49-69. doi: 10.1007/978-1-0716-4104-0_5. Methods Mol Biol. 2025. PMID: 39460914
-
SiMPl-GS: Advancing Cell Line Development via Synthetic Selection Marker for Next-Generation Biopharmaceutical Production.Adv Sci (Weinh). 2024 Oct;11(38):e2405593. doi: 10.1002/advs.202405593. Epub 2024 Aug 6. Adv Sci (Weinh). 2024. PMID: 39105414 Free PMC article.
References
Publication types
MeSH terms
Substances
LinkOut - more resources
Full Text Sources
Other Literature Sources
