

The world's largest High Arctic lake responds rapidly to climate warming
- PMID: 29599477
- PMCID: PMC5876346
- DOI: 10.1038/s41467-018-03685-z
The world's largest High Arctic lake responds rapidly to climate warming
Abstract
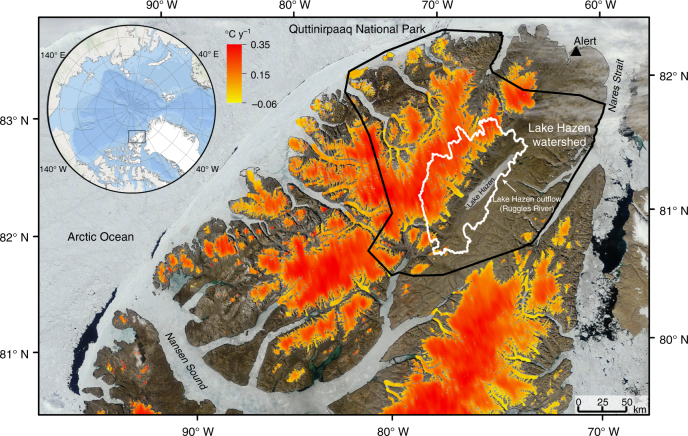
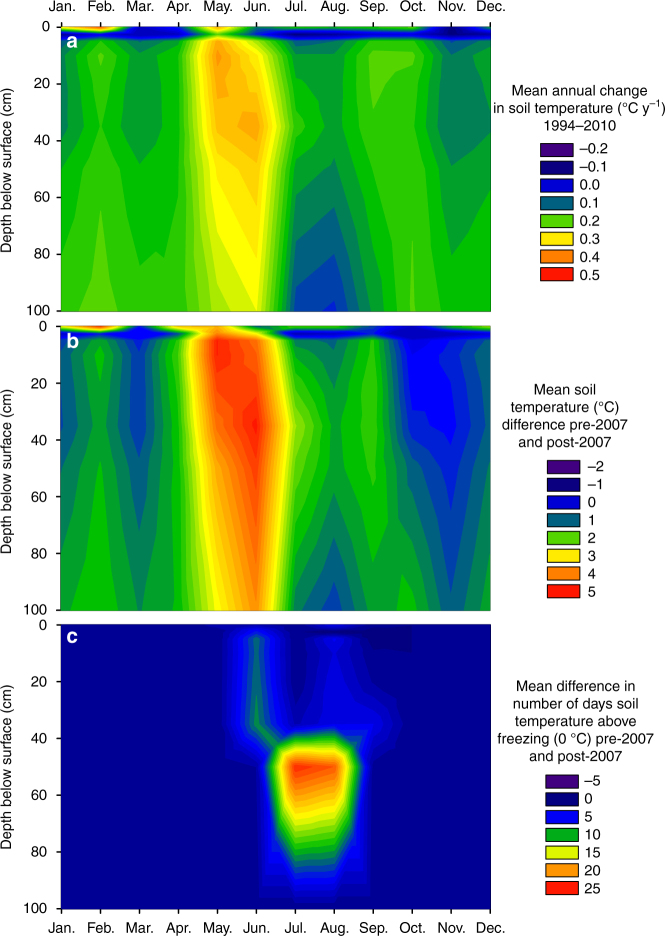
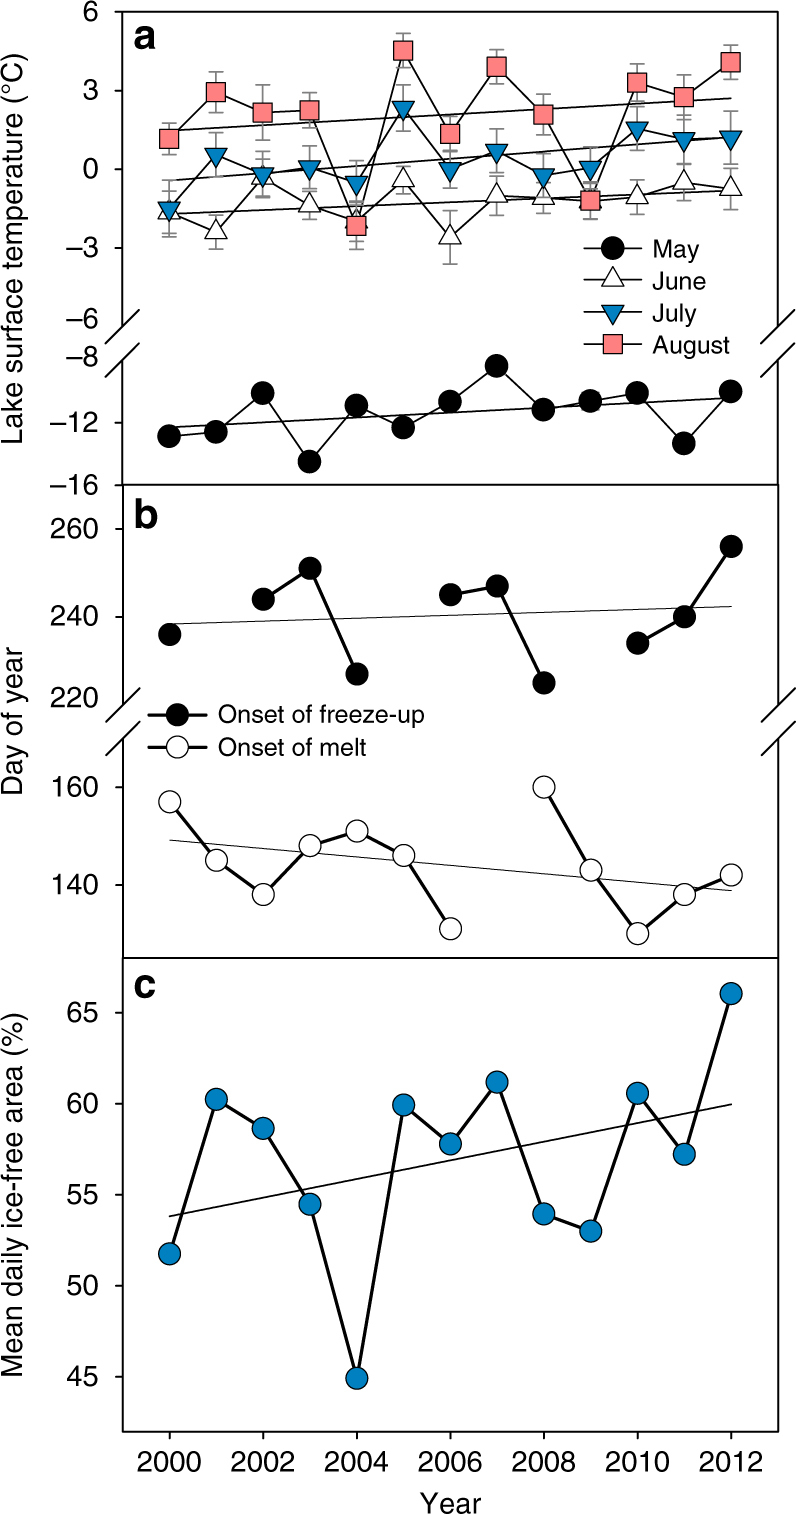
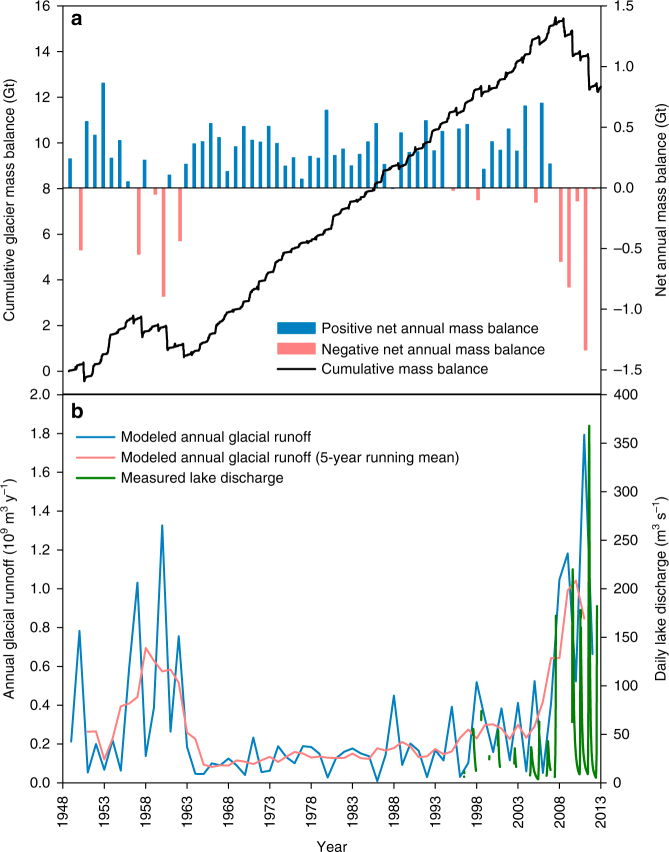
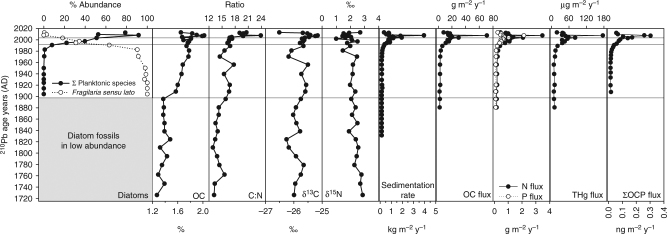
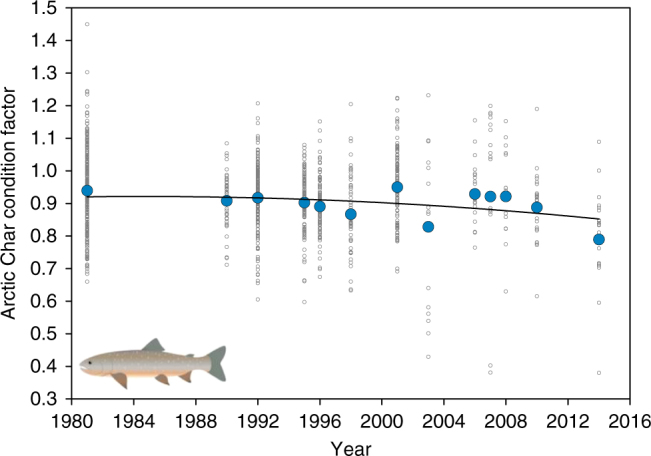
Using a whole-watershed approach and a combination of historical, contemporary, modeled and paleolimnological datasets, we show that the High Arctic's largest lake by volume (Lake Hazen) has succumbed to climate warming with only a ~1 °C relative increase in summer air temperatures. This warming deepened the soil active layer and triggered large mass losses from the watershed's glaciers, resulting in a ~10 times increase in delivery of glacial meltwaters, sediment, organic carbon and legacy contaminants to Lake Hazen, a >70% decrease in lake water residence time, and near certainty of summer ice-free conditions. Concomitantly, the community assemblage of diatom primary producers in the lake shifted dramatically with declining ice cover, from shoreline benthic to open-water planktonic species, and the physiological condition of the only fish species in the lake, Arctic Char, declined significantly. Collectively, these changes place Lake Hazen in a biogeochemical, limnological and ecological regime unprecedented within the past ~300 years.
Conflict of interest statement
The authors declare no competing interests.
Figures
Similar articles
-
Contrasting the ecological effects of decreasing ice cover versus accelerated glacial melt on the High Arctic's largest lake.Proc Biol Sci. 2020 Jun 24;287(1929):20201185. doi: 10.1098/rspb.2020.1185. Epub 2020 Jun 24. Proc Biol Sci. 2020. PMID: 32576110 Free PMC article.
-
Contemporary limnology of the rapidly changing glacierized watershed of the world's largest High Arctic lake.Sci Rep. 2019 Mar 14;9(1):4447. doi: 10.1038/s41598-019-39918-4. Sci Rep. 2019. PMID: 30872603 Free PMC article.
-
Drivers of Mercury Cycling in the Rapidly Changing Glacierized Watershed of the High Arctic's Largest Lake by Volume (Lake Hazen, Nunavut, Canada).Environ Sci Technol. 2019 Feb 5;53(3):1175-1185. doi: 10.1021/acs.est.8b05926. Epub 2019 Jan 11. Environ Sci Technol. 2019. PMID: 30596413
-
Persistent organic pollutants and metals in the freshwater biota of the Canadian Subarctic and Arctic: an overview.Sci Total Environ. 2005 Dec 1;351-352:94-147. doi: 10.1016/j.scitotenv.2005.01.052. Epub 2005 Oct 12. Sci Total Environ. 2005. PMID: 16225909 Review.
-
Recent climate change in the Arctic and its impact on contaminant pathways and interpretation of temporal trend data.Sci Total Environ. 2005 Apr 15;342(1-3):5-86. doi: 10.1016/j.scitotenv.2004.12.059. Epub 2005 Mar 19. Sci Total Environ. 2005. PMID: 15866268 Review.
Cited by
-
Monitoring the Multiple Stages of Climate Tipping Systems from Space: Do the GCOS Essential Climate Variables Meet the Needs?Surv Geophys. 2025;46(2):327-374. doi: 10.1007/s10712-024-09866-4. Epub 2025 Feb 18. Surv Geophys. 2025. PMID: 40417377 Free PMC article. Review.
-
Earlier ice loss accelerates lake warming in the Northern Hemisphere.Nat Commun. 2022 Sep 2;13(1):5156. doi: 10.1038/s41467-022-32830-y. Nat Commun. 2022. PMID: 36056046 Free PMC article.
-
Characterizing neutral and adaptive genomic differentiation in a changing climate: The most northerly freshwater fish as a model.Ecol Evol. 2019 Jan 15;9(4):2004-2017. doi: 10.1002/ece3.4891. eCollection 2019 Feb. Ecol Evol. 2019. PMID: 30847088 Free PMC article.
-
Physicochemical Drivers of Microbial Community Structure in Sediments of Lake Hazen, Nunavut, Canada.Front Microbiol. 2018 Jun 5;9:1138. doi: 10.3389/fmicb.2018.01138. eCollection 2018. Front Microbiol. 2018. PMID: 29922252 Free PMC article.
-
Inland water greenhouse gas emissions offset the terrestrial carbon sink in the northern cryosphere.Sci Adv. 2024 Sep 27;10(39):eadp0024. doi: 10.1126/sciadv.adp0024. Epub 2024 Sep 27. Sci Adv. 2024. PMID: 39331717 Free PMC article.
References
-
- Serreze MC, Barry RG. Processes and impacts of Arctic amplification: a research synthesis. Glob. Planet. Change. 2011;77:85–96. doi: 10.1016/j.gloplacha.2011.03.004. - DOI
-
- Taylor KE, Stouffer RJ, Meehl GA. An overview of CMIP5 and the experiment design. Bull. Am. Meteorol. Soc. 2012;93:485–498. doi: 10.1175/BAMS-D-11-00094.1. - DOI
-
- van Oldenborgh, G. J. KNMI Climate Explorer (Koninklijk Netherlands Meteorologisch Institut (KNMI), De Bilt, The Netherlands, 1999).
-
- Prowse T, et al. Arctic freshwater synthesis: summary of key emerging issues. J. J. Geophys. Res. Biogeosci. 2015;120:1887–1893. doi: 10.1002/2015JG003128. - DOI
-
- Laudon H, et al. Save northern high-latitude catchments. Nat. Geosci. 2017;10:324–325. doi: 10.1038/ngeo2947. - DOI
Publication types
LinkOut - more resources
Full Text Sources
Other Literature Sources
Miscellaneous
