Short-term dynamics and interactions of marine protist communities during the spring-summer transition
- PMID: 29599520
- PMCID: PMC6052004
- DOI: 10.1038/s41396-018-0097-x
Short-term dynamics and interactions of marine protist communities during the spring-summer transition
Abstract
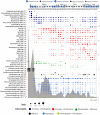
We examined the short-term variability, by daily to weekly sampling, of protist assemblages from March to July in surface water of the San Pedro Ocean Time-series station (eastern North Pacific), by V4 Illumina sequencing of the 18S rRNA gene. The sampling period encompassed a spring bloom followed by progression to summer conditions. Several protistan taxa displayed sharp increases and declines, with whole community Bray-Curtis dissimilarities of adjacent days being 66% in March and 40% in May. High initial abundance of parasitic Cercozoa Cryothecomonas longipes and Protaspis grandis coincided with a precipitous decline of blooming Pseudo-nitzschia diatoms, possibly suggesting their massive infection by these parasites; these cercozoans were hardly detectable afterwards. Canonical correspondence analysis indicated a limited predictability of community variability from environmental factors. This indicates that other factors are relevant in explaining changes in protist community composition at short temporal scales, such as interspecific relationships, stochastic processes, mixing with adjacent water, or advection of patches with different protist communities. Association network analysis revealed that interactions between the many parasitic OTUs and other taxa were overwhelmingly positive and suggest that although sometimes parasites may cause a crash of host populations, they may often follow their hosts and do not regularly cause enough mortality to potentially create negative correlations at the daily to weekly time scales we studied.
Conflict of interest statement
The authors declare that they have no conflict of interest.
Figures


Similar articles
-
Temporal Variability and Ecological Interactions of Parasitic Marine Syndiniales in Coastal Protist Communities.mSphere. 2020 May 27;5(3):e00209-20. doi: 10.1128/mSphere.00209-20. mSphere. 2020. PMID: 32461270 Free PMC article.
-
With a little help from my friends: importance of protist-protist interactions in structuring marine protistan communities in the San Pedro Channel.mSystems. 2025 Feb 18;10(2):e0104524. doi: 10.1128/msystems.01045-24. Epub 2025 Jan 29. mSystems. 2025. PMID: 39878540 Free PMC article.
-
Protist Interactions and Community Structure During Early Autumn in the Kerguelen Region (Southern Ocean).Protist. 2020 Feb;171(1):125709. doi: 10.1016/j.protis.2019.125709. Epub 2019 Dec 18. Protist. 2020. PMID: 32004979
-
Distribution and diversity of a protist predator Cryothecomonas (Cercozoa) in Arctic marine waters.J Eukaryot Microbiol. 2012 Jul-Aug;59(4):291-9. doi: 10.1111/j.1550-7408.2012.00631.x. Epub 2012 Jun 15. J Eukaryot Microbiol. 2012. PMID: 22703332
-
Marine protist associations and environmental impacts across trophic levels in the twilight zone and below.Curr Opin Microbiol. 2016 Jun;31:169-175. doi: 10.1016/j.mib.2016.04.001. Epub 2016 Apr 17. Curr Opin Microbiol. 2016. PMID: 27092409 Review.
Cited by
-
Seasonal variations and co-occurrence networks of bacterial communities in the water and sediment of artificial habitat in Laoshan Bay, China.PeerJ. 2022 Jan 4;9:e12705. doi: 10.7717/peerj.12705. eCollection 2022. PeerJ. 2022. PMID: 35036171 Free PMC article.
-
Unveiling pelagic-benthic coupling associated with the biological carbon pump in the Fram Strait (Arctic Ocean).Nat Commun. 2025 Jan 20;16(1):840. doi: 10.1038/s41467-024-55221-x. Nat Commun. 2025. PMID: 39833152 Free PMC article.
-
Endemic, cosmopolitan, and generalist taxa and their habitat affinities within a coastal marine microbiome.Sci Rep. 2024 Sep 28;14(1):22408. doi: 10.1038/s41598-024-69991-3. Sci Rep. 2024. PMID: 39333653 Free PMC article.
-
Changes in Bacterioplankton Communities Resulting From Direct and Indirect Interactions With Trace Metal Gradients in an Urbanized Marine Coastal Area.Front Microbiol. 2019 Feb 22;10:257. doi: 10.3389/fmicb.2019.00257. eCollection 2019. Front Microbiol. 2019. PMID: 30853948 Free PMC article.
-
The co-occurrence patterns and assembly mechanisms of microeukaryotic communities in geothermal ecosystems of the Qinghai-Tibet Plateau.Front Microbiol. 2025 Feb 4;16:1513944. doi: 10.3389/fmicb.2025.1513944. eCollection 2025. Front Microbiol. 2025. PMID: 39967736 Free PMC article.
References
-
- Pace NR. A molecular view of microbial diversity and the biosphere. Science. 1997;276:734–40. - PubMed
-
- Caron DA. New accomplishments and approaches for assessing protistan diversity and ecology in natural ecosystems. Bioscience. 2009;59:287–99.
-
- Fuhrman JA, Cram JA, Needham DM. Marine microbial dynamics and their ecological interpretation. Nat Rev Microbiol. 2015;13:133–46. - PubMed
-
- Su C, Lei L, Duan Y, Zhang KQ, Yang J. Culture-independent methods for studying environmental microorganisms: methods, application, and perspective. Appl Microbiol Biotechnol. 2012;93:993–1003. - PubMed
Publication types
MeSH terms
Substances
LinkOut - more resources
Full Text Sources
Other Literature Sources

