. 2018 Mar 15:12:18.
doi: 10.3389/fnana.2018.00018. eCollection 2018.

Topographic Organization of Inferior Olive Projections to the Zebrin II Stripes in the Pigeon Cerebellar Uvula

Affiliations

Topographic Organization of Inferior Olive Projections to the Zebrin II Stripes in the Pigeon Cerebellar Uvula

Iulia Craciun et al. Front Neuroanat. .

Abstract

This study was aimed at mapping the organization of the projections from the inferior olive (IO) to the ventral uvula in pigeons. The uvula is part of the vestibulocerebellum (VbC), which is involved in the processing of optic flow resulting from self-motion. As in other areas of the cerebellum, the uvula is organized into sagittal zones, which is apparent with respect to afferent inputs, the projection patterns of Purkinje cell (PC) efferents, the response properties of PCs and the expression of molecular markers such as zebrin II (ZII). ZII is heterogeneously expressed such that there are sagittal stripes of PCs with high ZII expression (ZII+), alternating with sagittal stripes of PCs with little to no ZII expression (ZII-). We have previously demonstrated that a ZII+/- stripe pair in the uvula constitutes a functional unit, insofar as the complex spike activity (CSA) of all PCs within a ZII+/- stripe pair respond to the same type of optic flow stimuli. In the present study we sought to map the climbing fiber (CF) inputs from the IO to the ZII+ and ZII- stripes in the uvula. We injected fluorescent Cholera Toxin B (CTB) of different colors (red and green) into ZII+ and ZII- bands of functional stripe pair. Injections in the ZII+ and ZII- bands resulted in retrograde labeling of spatially separate, but adjacent regions in the IO. Thus, although a ZII+/- stripe pair represents a functional unit in the pigeon uvula, CF inputs to the ZII+ and ZII- stripes of a unit arise from separate regions of the IO.

Keywords: aldolase C; cerebellum; climbing fiber; inferior olive; optic flow; uvula; zebrin II.


Figures
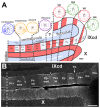
Figure 1
Figure 1
(A) shows the optic flow zones and zebrin II (ZII) pattern in the pigeon vestibulocerebellum (VbC). A coronal section through the VbC (folia IXcd and X) is depicted. The alternating ZII+ (red) and ZII− (pale blue) stripes are numbered from P1+/− most medially to P7+/− laterally, with ZII+ and ZII– stripes alternating (Adapted from Pakan et al., with permission). (B) is a photomicrograph of ZII immunoreactivity through a caudal section of IXcd showing stripes P1+ through P5+. P1− is bisected by a satellite ZII+ band designated “?”, dividing the stripe into medial and lateral halves (P1−med; P1−lat). P2+ is divided by a ZII– “notch”, indicated by the inverted triangle, dividing P2+ into medial and lateral halves (P2+med; P2+lat) (Wylie et al., 2007). In the uvula, the optic flow zones from medial to lateral are as follows: contraction zone (P1+/P1– med); expansion/ascent zone (P1–lat/P2+med); descent zone (P2+lat/P2–) (Graham and Wylie, 2012). Purkinje cells (PCs) in the flocculus zones respond to optic flow resulting from rotation about either the vertical axis (VA) or an horizontal axis (HA). There are two VA zones, spanning P4+/− and P6+/−, inderdigitated with two HA zones, spanning P5+/− and P7+/− (Pakan et al., 2011). PCs in the P3+/− stripe do not respond to optic flow stimuli and their function is unknown (Graham and Wylie, 2012). The sagittal organization of the optic flow zones extends into the nodulus (folia X), although all PCs are ZII+ (Pakan et al., , , ; Pakan and Wylie, ; Graham and Wylie, 2012). Scale bars = 200 μm in (A), 300 μm in (B).
Figure 2
Figure 2
(A) shows an example of a Cholera Toxin B (CTB) injection site (red) in a section immunoprocessed for ZII (green; i.e., Alexafluor 488 scndry antibody). The injection was in the P2+med stripe of the uvula. The triangle indicates the ZII− notch separating the P2+med and P2+lat. (B) shows a thionine-stained section through the inferior olive (IO) showing the three subdivisions: medial column of the inferior olive (mcIO), ventral lamella (vl) and dorsal lamella (dl). The course of the twelfth nerve (NXII) is through the lateral part of mcIO. The white box indicates the general region where retrograde labeled cells were found from injections in the uvula. The inset shows a coronal cross section through the medulla and the red box indicates the region where the olive is found. (C,D) respectively, show retrograde labeled cells from red and green CTB injections. (E) shows the same section in (D) subsequently stained with thionine. Arrows in (D,E) indicate corresponding neurons. Scale bars = 200 μm in (A); 250 μm in (B); 500 μm in (B) inset; 100 μm in (C); 50 μm in (E).
Figure 3
Figure 3
The locations of all CTB injection sites in the ventral uvula were reconstructed from serial coronal sections. The color of the injection site indicates the color of CTB injected (red or green). Injection sites (A–L) are shown from most medial in (A,B) (P1+) to most lateral in (K,L) (P2–). For each case, the distance (in μm) of the caudal-most section (i.e., top) from the posterior pole of IXcd is indicated. For example, the injections in case Uv01 (A) were located about 2 mm posterior to those in case Uv12 (B). The midline is represented as a dashed blue line. See Table 1 for a detailed account of each injection site. Scale bar = 500 μm.
Figure 4
Figure 4
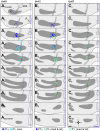
Retrograde labeling in the IO from selected P1+ and P1– injections in the contraction zone of the ventral uvula (see Figure 3). (A), (B) and (C) respectively, show the retrograde labeling from cases Uv01, Uv12 and Uv07. For each, 10 coronal sections through the IO from 1 series (of 3) are shown, from caudal (top, 1) to rostral (bottom, 10), 120 μm apart. For each section, labeled cells from that section are shown, as well as labeled cells from adjacent sections: i.e., retrograde labeling is superimposed from three consecutive 40 μm sections. The IO is represented by gray shading, and the curvy black lines represent the course of the hypoglossal nerve (NXII). Dark blue dots represent retrograde labeled cells from the P1+ injections (A,B), light blue dots represent those from the P1–med injection (A), and light blue dots with yellow centers represent cells labeled from the injections that included both the medial and lateral halves of P1− (P1−med and P1−lat) (B,C). d, dorsal; v, ventral; m, medial; l, lateral; R, raphe nucleus. Scale bar = 200 μm.
Figure 5
Figure 5
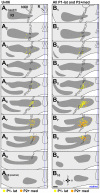
Retrograde IO labeling from injections in the expansion/ascent optic flow zone. (A) shows labeled cells from case Uv06, and (B) shows labeling from all injections in P1−lat and P2+med collapsed onto an idealized series (cases Uv06, Uv08, Un05, Uv02, Uv16; see Figures 3D–H and Table 1). The locations of labeled cells from injections in P1−lat and P2+med are represented by yellow and orange dots, respectively. See caption to Figure 4 for additional details. Scale bar = 200 μm.
Figure 6
Figure 6
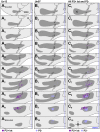
Retrograde IO labeling from injections in the descent optic flow zone. (A,B) show the locations of retrogradely labeled cells in the IO from cases Uv13 and Un07, respectively. (C) shows the labeling from all injections in P2+lat and P2− collapsed onto an idealized series (cases Uv11, Uv13, Un07, Uv04; see Figures 3I–L and Table 1). The locations of labeled cells from injections in P2+lat and P2− are represented by dark purple and light purple dots, respectively. See caption to Figure 4 for additional details. Scale bar = 200 μm.
Figure 7
Figure 7
(A–D) Reconstructions of retrograde labeling in the mcIO as projected onto the horizontal plane. These were reconstructed from serial sections 40 μm apart in the rostro-caudal dimension (y-axes) and the distance of each retrogradely labeled cell from the midline was measured (x-axes). (A) shows retrograde labeled olive cells from injections in P1+ (dark blue; cases Uv01 green CTB injection, Uv12 red CTB injection; see Figure 3) and P1–med (light blue; Uv01 red CTB injection) stripes. (B) shows retrograde labeling from injections in P1–lat (yellow; Uv06 red, Uv08, Un05) and P2+med (orange; Uv06 green, Uv02, Uv16). (C) shows retrograde labeling from injections in P2+lat (dark purple; Uv11, Uv13) and P2– (light purple; Un07, Uv04). The magenta in (A–C) represents overlap. (D) shows 80% confidence ellipses that fit these six distributions. In addition, the regions that project to the ZII stripes in the flocculus (P4+/− to P7+/−) are shown based on data from Wylie et al. (2017). (E) shows a schematic of the climbing fiber projections (CFs) from each region of the mcIO to the ZII stripes in the optic flow zones in folium IXcd (Adapted from Pakan et al., with permission). c, caudal; r, rostral; m, medial; l, lateral.

Similar articles

Cited by

References

    1. Ahn A. H., Dziennis S., Hawkes R., Herrup K. (1994). The cloning of zebrin II reveals its identity with aldolase C. Development 120, 2081–2090. - PubMed
    1. Akintunde A., Eisenman L. M. (1994). External cuneocerebellar projection and Purkinje cell zebrin II bands: a direct comparison of parasagittal banding in the mouse cerebellum. J. Chem. Neuroanat. 7, 75–86. 10.1016/0891-0618(94)90009-4 - DOI - PubMed
    1. Apps R., Garwicz M. (2005). Anatomical and physiological foundations of cerebellar information processing. Nat. Rev. Neurosci. 6, 297–311. 10.1038/nrn1646 - DOI - PubMed
    1. Arends J. J. A., Voogd J. (1989). Topographic aspects of the olivocerebellar system in the pigeon. Exp. Brain Res. Suppl. 17, 52–57. 10.1007/978-3-642-73920-0_6 - DOI
    1. Armstrong C. L., Hawkes R. (2000). Pattern formation in the cerebellar cortex. Biochem. Cell Biol. 78, 551–562. 10.1139/o00-071 - DOI - PubMed