

CD86 Expression by Monocytes Influences an Immunomodulatory Profile in Asymptomatic Patients with Chronic Chagas Disease
- PMID: 29599775
- PMCID: PMC5857740
- DOI: 10.3389/fimmu.2018.00454
CD86 Expression by Monocytes Influences an Immunomodulatory Profile in Asymptomatic Patients with Chronic Chagas Disease
Abstract
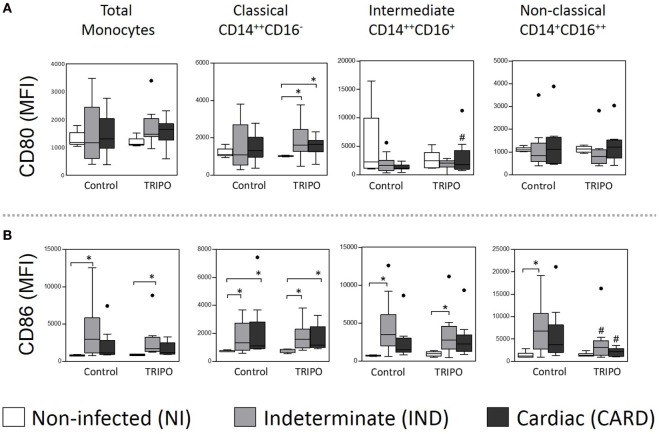
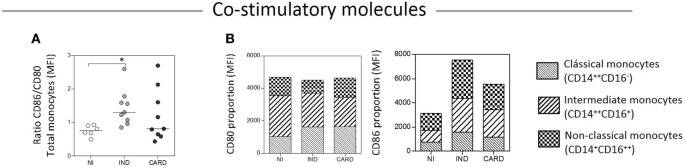
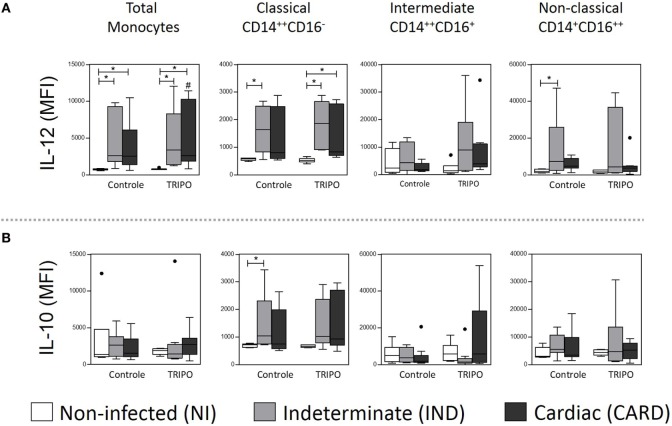
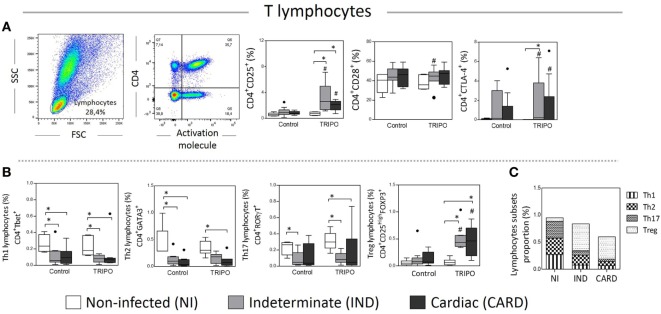
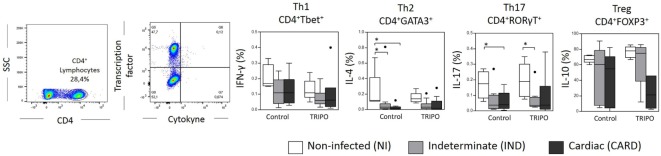
In the chronic phase of Chagas disease, 60% of the patients develop the asymptomatic form known as indeterminate (IND). The remaining 30% of the patients develop a life-threatening form in which digestive and/or cardiac (CARD) alterations take place. The mechanisms underlying the development of severe forms of Chagas disease remain poorly understood. It is well known that interactions between immune cells such as monocytes and lymphocytes drive immune responses. Further, the co-stimulatory molecules CD80 and CD86 expressed by monocytes and subsets induce lymphocyte activation, thereby triggering cellular immune response. Here, we revealed, for the first time, the functional-phenotypic profile of monocytes subsets in Chagas disease. Using flow cytometry, we evaluated the effect of in vitro stimulation with Trypanosoma cruzi antigens on the expression of the co-stimulatory molecules CD80 and CD86 in different monocyte subsets of patients with IND and CARD clinical forms of Chagas disease. We also assessed the expression of toll-like receptor (TLR)-2, TLR-4, TLR-9, HLA-DR, IL-10, and IL-12 in the monocyte subsets and of CTLA-4 and CD28, ligands of CD80 and CD86, in T lymphocytes. CD86 expression in all monocyte subsets was higher in IND patients when compared with non-infected (NI) individuals. After stimulation with T. cruzi, these patients also showed a higher frequency of CD4+CTLA-4+ T lymphocytes than NI individuals. We found an association between CD80 and CD28, and between CD86 and CTLA-4 expression, with a high frequency of regulatory T (Treg) cells in IND patients. We proposed that CD86 may be involved in immunoregulation by its association with CTLA-4 in asymptomatic patients. CD86 and CTLA-4 interaction may influence Treg activation, and this could represent a new strategy to control inflammation and tissue damage.
Keywords: chagas disease; immune response; immunoregulation; innate immunity; monocytes.
Figures


Similar articles
-
Modulation of Regulatory T Cells Activity by Distinct CD80 and CD86 Interactions With CD28/CTLA-4 in Chagas Cardiomyopathy.Front Cardiovasc Med. 2022 May 19;9:750876. doi: 10.3389/fcvm.2022.750876. eCollection 2022. Front Cardiovasc Med. 2022. PMID: 35665256 Free PMC article.
-
Trypanosoma cruzi infection induces differential modulation of costimulatory molecules and cytokines by monocytes and T cells from patients with indeterminate and cardiac Chagas' disease.Infect Immun. 2007 Apr;75(4):1886-94. doi: 10.1128/IAI.01931-06. Epub 2007 Feb 5. Infect Immun. 2007. PMID: 17283096 Free PMC article.
-
Expression of costimulatory molecules CD80 and CD86 and their receptors CD28, CTLA-4 on malignant ascites CD3+ tumour-infiltrating lymphocytes (TIL) from patients with ovarian and other types of peritoneal carcinomatosis.Clin Exp Immunol. 2000 Jan;119(1):19-27. doi: 10.1046/j.1365-2249.2000.01105.x. Clin Exp Immunol. 2000. PMID: 10606960 Free PMC article.
-
Regulatory T cells phenotype in different clinical forms of Chagas' disease.PLoS Negl Trop Dis. 2011;5(5):e992. doi: 10.1371/journal.pntd.0000992. Epub 2011 May 31. PLoS Negl Trop Dis. 2011. PMID: 21655351 Free PMC article. Review.
-
Molecular and Cellular Functions of CTLA-4.Adv Exp Med Biol. 2020;1248:7-32. doi: 10.1007/978-981-15-3266-5_2. Adv Exp Med Biol. 2020. PMID: 32185705 Review.
Cited by
-
Study of Monocyte Subsets and Their Surface Expression of CD86 and Serum IL-17 Compared to Serum Procalcitonin as Markers of Early Neonatal Sepsis.Infect Drug Resist. 2021 Dec 14;14:5375-5382. doi: 10.2147/IDR.S335057. eCollection 2021. Infect Drug Resist. 2021. PMID: 34934331 Free PMC article.
-
Increased Natural Killer (NK)-cell cytotoxicity and Trypanosoma cruzi-specific memory B cells in subjects with discordant serology for Chagas disease.Biochim Biophys Acta Mol Basis Dis. 2024 Aug;1870(6):167237. doi: 10.1016/j.bbadis.2024.167237. Epub 2024 May 13. Biochim Biophys Acta Mol Basis Dis. 2024. PMID: 38750768 Free PMC article.
-
Intermediate Monocytes and Cytokine Production Associated With Severe Forms of Chagas Disease.Front Immunol. 2019 Jul 19;10:1671. doi: 10.3389/fimmu.2019.01671. eCollection 2019. Front Immunol. 2019. PMID: 31379862 Free PMC article.
-
Impact of cooperative or competitive dynamics between the yeast Saccharomyces cerevisiae and lactobacilli on the immune response of the host.Front Immunol. 2024 Oct 10;15:1399842. doi: 10.3389/fimmu.2024.1399842. eCollection 2024. Front Immunol. 2024. PMID: 39450162 Free PMC article. Review.
-
How toll-like receptors reveal monocyte plasticity: the cutting edge of antiinflammatory therapy.Cell Mol Life Sci. 2019 Feb;76(4):745-755. doi: 10.1007/s00018-018-2959-9. Epub 2018 Nov 9. Cell Mol Life Sci. 2019. PMID: 30413835 Free PMC article. Review.
References
-
- Martín UO. Circulating immune complexes in different developmental stages of Chagas’ disease. Medicina (B Aires) (1987) 47:159–62. - PubMed
Publication types
MeSH terms
Substances
LinkOut - more resources
Full Text Sources
Other Literature Sources
Medical
Research Materials