. 2018 Mar 15:9:341.
doi: 10.3389/fpls.2018.00341. eCollection 2018.

Transcript Profiling Identifies NAC-Domain Genes Involved in Regulating Wall Ingrowth Deposition in Phloem Parenchyma Transfer Cells of Arabidopsis thaliana

Affiliations

Transcript Profiling Identifies NAC-Domain Genes Involved in Regulating Wall Ingrowth Deposition in Phloem Parenchyma Transfer Cells of Arabidopsis thaliana

Yuzhou Wu et al. Front Plant Sci. .

Abstract

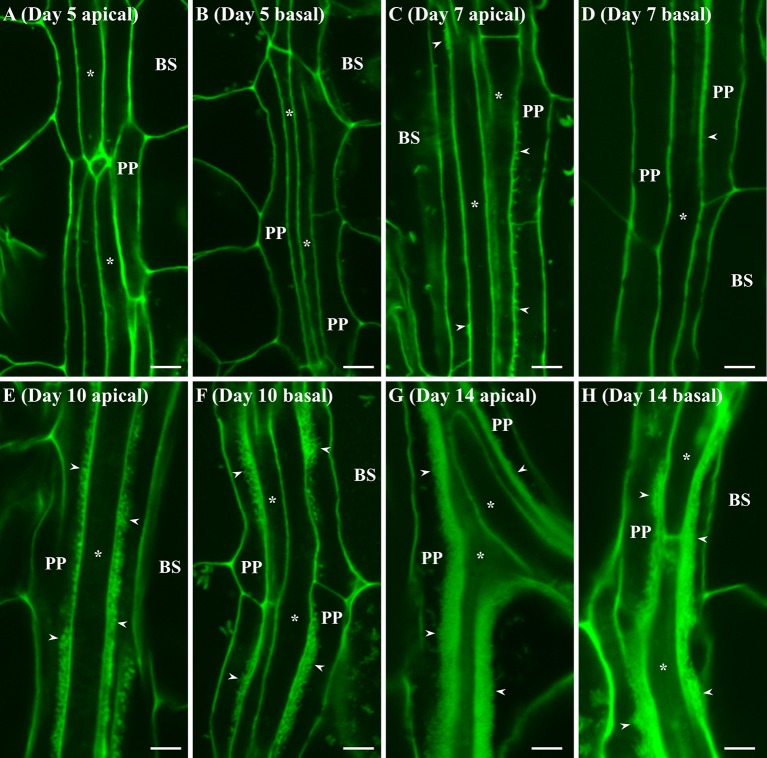
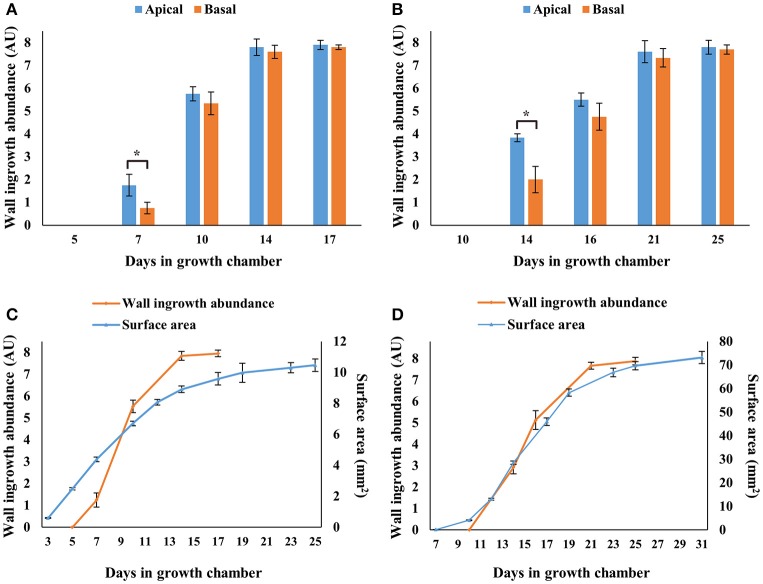
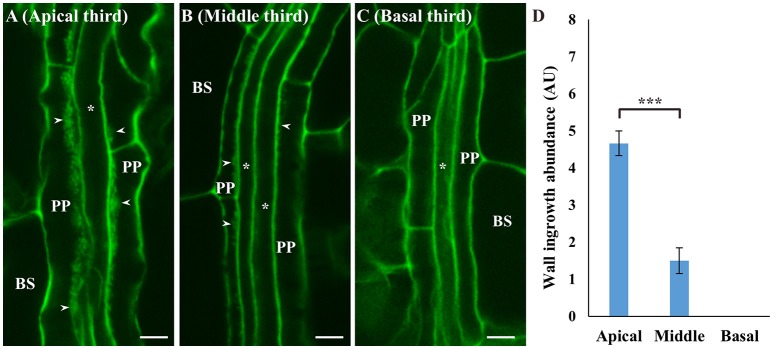
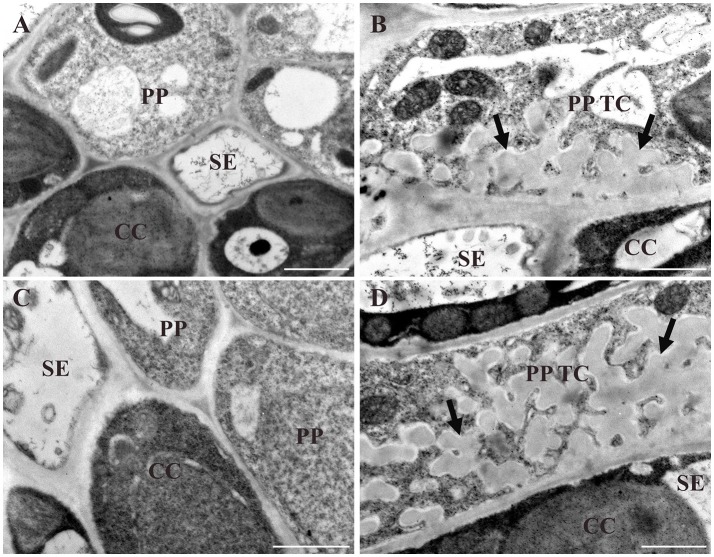
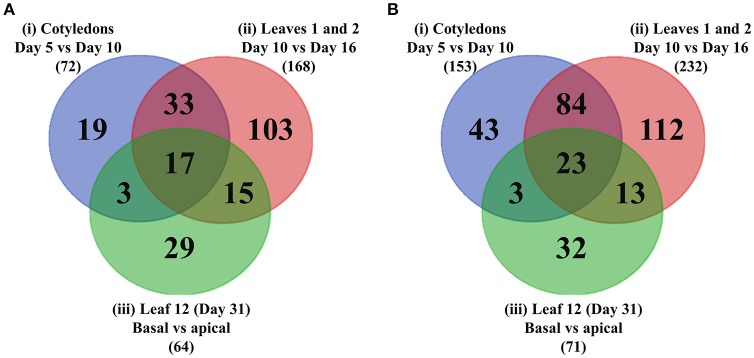
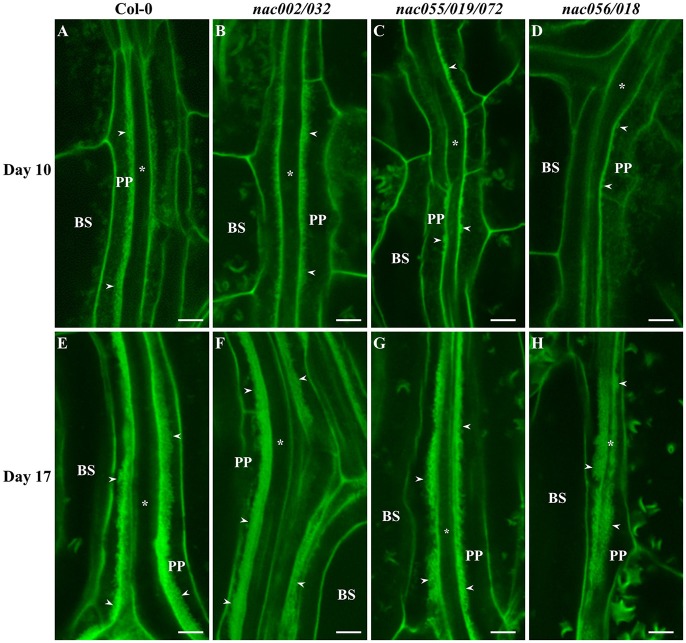
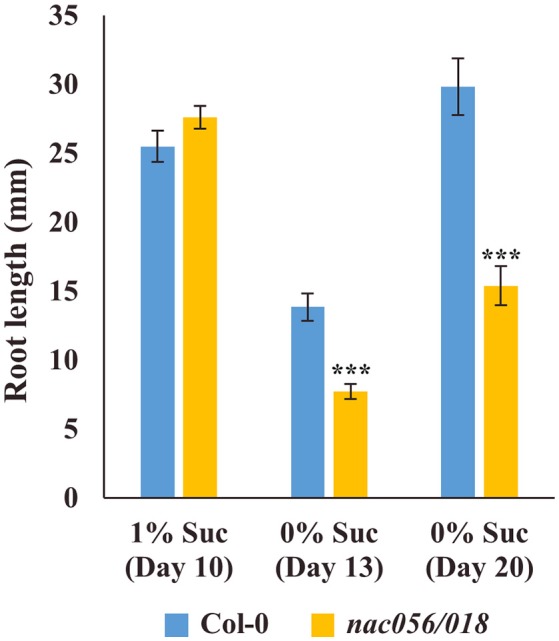
Transfer cells (TCs) play important roles in facilitating enhanced rates of nutrient transport at key apoplasmic/symplasmic junctions along the nutrient acquisition and transport pathways in plants. TCs achieve this capacity by developing elaborate wall ingrowth networks which serve to increase plasma membrane surface area thus increasing the cell's surface area-to-volume ratio to achieve increased flux of nutrients across the plasma membrane. Phloem parenchyma (PP) cells of Arabidopsis leaf veins trans-differentiate to become PP TCs which likely function in a two-step phloem loading mechanism by facilitating unloading of photoassimilates into the apoplasm for subsequent energy-dependent uptake into the sieve element/companion cell (SE/CC) complex. We are using PP TCs in Arabidopsis as a genetic model to identify transcription factors involved in coordinating deposition of the wall ingrowth network. Confocal imaging of pseudo-Schiff propidium iodide-stained tissue revealed different profiles of temporal development of wall ingrowth deposition across maturing cotyledons and juvenile leaves, and a basipetal gradient of deposition across mature adult leaves. RNA-Seq analysis was undertaken to identify differentially expressed genes common to these three different profiles of wall ingrowth deposition. This analysis identified 68 transcription factors up-regulated two-fold or more in at least two of the three experimental comparisons, with six of these transcription factors belonging to Clade III of the NAC-domain family. Phenotypic analysis of these NAC genes using insertional mutants revealed significant reductions in levels of wall ingrowth deposition, particularly in a double mutant of NAC056 and NAC018, as well as compromised sucrose-dependent root growth, indicating impaired capacity for phloem loading. Collectively, these results support the proposition that Clade III members of the NAC-domain family in Arabidopsis play important roles in regulating wall ingrowth deposition in PP TCs.

Keywords: Arabidopsis thaliana; RNA-Seq; phloem parenchyma; transcription factors; transfer cells; wall ingrowths.


Figures

Figure 1
Figure 1
Confocal imaging of wall ingrowth deposition in PP TCs of Arabidopsis cotyledons. No evidence of wall ingrowth deposition was detected in PP cells of either the apical (A) or basal (B) half of cotyledons at day 5. By day 7, evidence of wall ingrowth deposition was detected as discrete fluorescent projections in PP TCs in the apical region of cotyledons (C) but only early stages of such protuberances were seen in the basal region (D). By 10 days, PP TCs in both apical (E) and basal (F) regions of cotyledons showed extensive wall ingrowth deposition along the SE/CC border of PP TCs. At day 14, wall ingrowths in PP TCs in both apical (G) and basal (H) regions of the cotyledon were massively deposited and occupied a considerable volume of the PP TC. BS denotes bundle sheath cells; asterisks indicate SE/CCs; PP denotes PP cell or PP TC, as appropriate; arrowheads indicate wall ingrowths in PP TCs. The fluorescent fragments occasionally seen in BS cells correspond to remnant starch grains not completely extracted by the bleach treatment. Scale bars = 5 μm.
Figure 2
Figure 2
Confocal imaging of wall ingrowth deposition in PP TCs of Leaf 1 and 2 from Arabidopsis. At day 10, no wall ingrowths were detected in PP TCs in either apical (A) or basal (B) halves of the leaf. By day 14, the apical half of Leaf 1 and 2 (C) displayed dense clusters of wall ingrowths in PP TCs but this was less abundant in basal regions (D). By day 16, continuous bands of wall ingrowth deposition were seen in PP TCs in both apical (E) and basal (F) regions of the leaf. At day 21, thick layers of wall ingrowth were deposited along the entire PP TC border in both apical (G) and basal (H) regions of the leaf. BS denotes bundle sheath cells; asterisks indicate SE/CCs; PP denotes PP cell or PP TC, as appropriate; arrowheads indicate wall ingrowths in PP TCs. The fluorescent fragments occasionally seen in BS and PP cells correspond to remnant starch grains not completely extracted by the bleach treatment. Scale bars = 5 μm.
Figure 3
Figure 3
Semi-quantitative analysis of wall ingrowth deposition in cotyledons and first leaves at selected developmental stages, and relationship with surface area expansion across Arabidopsis rosette development. Wall ingrowth deposition was not detected in cotyledons (A,C) or Leaf 1 and 2 (B,D) at days 5 and 10, respectively, but increased dramatically thereafter and was maximally abundant by day 14 in cotyledons and day 21 in Leaf 1 and 2. Differences in wall ingrowth abundance in PP TCs between apical (blue bars) and basal (orange bars) regions of the organs was only statistically different in cotyledons at day 7 and leaves at day 14, where both showed ~50% reduction in the basal half compared to the apical half. Orange lines in (C,D) represent average scores of wall ingrowth abundance in PP TCs combined from apical and basal regions of cotyledons (A) and leaves (B), respectively. Blue lines in (C,D) represent cotyledon and Leaf 1 and 2 surface areas, respectively, determined from images imported into ImageJ. Data shows mean ± SE of scores for wall ingrowth deposition in arbitrary units (see Nguyen et al., 2017), and for surface area in mm2. *P < 0.05, n >3, student's t-test.
Figure 4
Figure 4
Deposition of wall ingrowths in PP TCs of minor veins in apical, middle and basal regions of rosette Leaf 12 at day 31. Thick stretches of wall ingrowth deposition can be seen in PP TCs in a minor vein in the apical third of the leaf (A), with less abundant deposition in the middle third of the leaf (B), and no wall ingrowths seen in PP cells in the basal third of the leaf (C). BS denotes bundle sheath cells; asterisks indicate SE/CCs; PP denotes either PP or PP TCs as appropriate; arrowheads indicate wall ingrowths. Scale bars = 5 μm. (D) Semi-quantitative analysis of wall ingrowth deposition showed that wall ingrowth abundance significantly decreased from the tip (apical) to the base (basal) of the leaf. Data shows mean ± SE of scores for wall ingrowth deposition in arbitrary units. ***P < 0.001, student's t-test, n > 6).
Figure 5
Figure 5
TEM analysis of different stages of wall ingrowth deposition in PP TCs. Wall ingrowths are absent in PP cells of day 5 cotyledons (A) or day 10 juvenile Leaf 1 (C). By comparison, extensive deposition is seen in PP TCs in day 10 cotyledons (B) and day 16 Leaf 1 (D). While these ingrowths occupy a substantial volume of the PP TC, their deposition is clearly restricted or focused to the face(s) of the PP TC abutting cells of the SE/CC complex. BS, CC and SE denote bundle sheath cell, companion cell and sieve element, respectively; PP denotes phloem parenchyma cell; PP TC denotes phloem parenchyma transfer cell; arrows indicate deposition of wall ingrowths. Scale bars = 1 μm.
Figure 6
Figure 6
Venn diagrams showing intersections of transcription factors differentially up- or –down-regulated across wall ingrowth deposition in PP TCs of different organs from Arabidopsis grown. (A) Up-regulated genes. (B) Down-regulated genes. In each case the three circles represent the three experimental comparisons: Blue—cotyledons at day 5 vs. day 10; Red - first leaves at day 10 vs. day 16; Green - basal vs. apical thirds of Leaf 12 at day 31. Total number of differentially regulated genes in each of the three experimental comparisons, i.e., (i)–(iii), for each category is indicated in brackets.
Figure 7
Figure 7
Confocal imaging of wall ingrowth deposition in PP TCs of Arabidopsis cotyledons from Col-0 and nac mutants. By day 10, PP TCs in cotyledons from both Col-0 (A) and nac002/032 (B) showed extensive wall ingrowth deposition along the face of PP TCs adjacent to SE/CCs. In contrast, evidence of wall ingrowth deposition was detected only as discrete patches in PP TCs from cotyledons of nac055/019/072 (C) or as small projections in nac056/018 (D). At day 17, wall ingrowths in PP TCs of cotyledons from Col-0 (E), nac002/032 (F), nac055/019/072 (G) and nac056/018 (H) were highly abundant (Class V; 7–8 points) and occupied a considerable volume of the PP TC. BS denotes bundle sheath cells; asterisks indicate SE/CCs; PP denotes PP cell or PP TC, as appropriate; arrowheads indicate wall ingrowths in PP TCs. The crescent-shaped fluorescent fragments occasionally seen in BS cells correspond to remnant starch grains not completely extracted by the bleach treatment. Scale bars = 5 μm.
Figure 8
Figure 8
Confocal imaging of wall ingrowth deposition in PP TCs of Arabidopsis Leaf 1 and 2 from Col-0 and nac mutants. By day 17, continuous bands of wall ingrowth deposition were seen in PP TCs from first leaves of both Col-0 (A) and nac002/032 (B). In contrast, wall ingrowths in nac055/019/072 were deposited as mostly discontinuous patches or clumps (C), or as discrete projections in nac056/018 (D). By day 25, wall ingrowths in Col-0 (E) and nac002/032 (F) were seen as thick bands representing massive deposition (Class V; 7–8 points), while bands in nac055/019/072 (G) and nac056/018 (H) appeared to be thinner and occupied less volume of the PP TCs (Class IV; 5–6 points). BS denotes bundle sheath cells; asterisks indicate SE/CCs; PP denotes PP cell or PP TC, as appropriate; arrowheads indicate wall ingrowths in PP TCs. The fluorescent fragments occasionally seen in BS cells correspond to remnant starch grains not completely extracted by the bleach treatment. Scale bars = 5 μm.
Figure 9
Figure 9
Semi-quantitative analysis of wall ingrowth deposition in Arabidopsis cotyledons and first leaves from Col-0 and nac mutants at selected developmental stages. (A) In cotyledons, by day 10 wall ingrowth deposition in both Col-0 and nac002/032 was indistinguishable, whereas deposition was significantly decreased in both nac055/019/072 (P < 0.05) and nac056/018 (P < 0.01). By day 17, however, no difference in wall ingrowth abundance was observed in any nac mutant compared to Col-0. (B) For Leaf 1 and 2 at day 17, wall ingrowth deposition in both Col-0 and nac002/032 was indistinguishable, whereas deposition was significantly decreased in both nac055/019/072 (P < 0.01) and nac056/018 (P < 0.001). By day 25, however, again, no differences in wall ingrowth abundance were seen in nac002/032 compared to Col-0, but abundance was significantly reduced in nac055/019/072 (P < 0.01) and nac056/018 (P < 0.001) compared to Col-0. Data shows mean ± SE of scores for wall ingrowth deposition in arbitrary units according to the classification scheme of Nguyen et al. (2017). *P < 0.05; **P < 0.01; ***P < 0.001, student's t-test comparing wall ingrowth scores in each mutant line compared to Col-0, at each developmental stage; n = 5–10.
Figure 10
Figure 10
Root growth assay of nac056/018 mutant in presence or absence of added sucrose. Seeds of Col-0 or nac056/018 were grown on nutrient agar plates in the presence or absence of 1% (w/v) sucrose. After 10 days in the presence of sucrose, root growth in the two lines was comparable. At 13 days in the absence of sucrose, root growth of nac056/018 was significantly reduced compared to Col-0, and this reduction continued for roots grown for 20 days in the absence of sucrose. Data shows mean ± SE for root length, student's t-test, ***P < 0.001, n ≥ 15.

Similar articles

Cited by

References

    1. Aida M., Ishida T., Fukaki H., Fujisawa H., Tasaka M. (1997). Genes involved in organ separation in Arabidopsis: an analysis of the cup-shaped cotyledon mutant. Plant Cell 9, 841–857. 10.1105/tpc.9.6.841 - DOI - PMC - PubMed
    1. Allu A. D., Brotman Y., Xue G. P., Balazadeh S. (2016). Transcription factor ANAC032 modulates JA/SA signalling in response to Pseudomonas syringae infection. EMBO Rep. 17, 1578–1589. 10.15252/embr.201642197 - DOI - PMC - PubMed
    1. Amiard V., Demmig-Adams B., Mueh K. E., Turgeon R., Combs A. F., Adams W. W., III. (2007). Role of light and jasmonic acid signaling in regulating foliar phloem cell wall ingrowth development. New Phytol. 173, 722–731. 10.1111/j.1469-8137.2006.01954.x - DOI - PubMed
    1. Amiard V., Mueh K. E., Demmig-Adams B., Ebbert V., Turgeon R., Adams W. W., III. (2005). Anatomical and photosynthetic acclimation to the light environment in species with differing mechanisms of phloem loading. Proc. Natl. Acad. Sci. U.S.A. 102, 12968–12973. 10.1073/pnas.0503784102 - DOI - PMC - PubMed
    1. Andriunas F. A., Zhang H. M., Weber H., McCurdy D. W., Offler C. E., Patrick J. W. (2011). Glucose and ethylene signalling pathways converge to regulate trans-differentiation of epidermal transfer cells in Vicia narbonensis cotyledons. Plant J. 68, 987–998. 10.1111/j.1365-313X.2011.04749.x - DOI - PubMed