Shifts in the Gut Metabolome and Clostridium difficile Transcriptome throughout Colonization and Infection in a Mouse Model
- PMID: 29600278
- PMCID: PMC5874438
- DOI: 10.1128/mSphere.00089-18
Shifts in the Gut Metabolome and Clostridium difficile Transcriptome throughout Colonization and Infection in a Mouse Model
Abstract
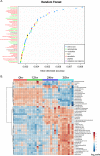
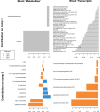
Antibiotics alter the gut microbiota and decrease resistance to Clostridium difficile colonization; however, the mechanisms driving colonization resistance are not well understood. Loss of resistance to C. difficile colonization due to antibiotic treatment is associated with alterations in the gut metabolome, specifically, with increases in levels of nutrients that C. difficile can utilize for growth in vitro. To define the nutrients that C. difficile requires for colonization and pathogenesis in vivo, we used a combination of mass spectrometry and RNA sequencing (RNA Seq) to model the gut metabolome and C. difficile transcriptome throughout an acute infection in a mouse model at the following time points: 0, 12, 24, and 30 h. We also performed multivariate-based integration of the omics data to define the signatures that were most important throughout colonization and infection. Here we show that amino acids, in particular, proline and branched-chain amino acids, and carbohydrates decrease in abundance over time in the mouse cecum and that C. difficile gene expression is consistent with their utilization in vivo. This was also reinforced by the multivariate-based integration of the omics data where we were able to discriminate the metabolites and transcripts that support C. difficile physiology between the different time points throughout colonization and infection. This report illustrates how important the availability of amino acids and other nutrients is for the initial stages of C. difficile colonization and progression of disease. Future studies identifying the source of the nutrients and engineering bacteria capable of outcompeting C. difficile in the gut will be important for developing new targeted bacterial therapeutics. IMPORTANCE Clostridium difficile is a bacterial pathogen of global significance that is a major cause of antibiotic-associated diarrhea. Antibiotics deplete the indigenous gut microbiota and change the metabolic environment in the gut to one favoring C. difficile growth. Here we used metabolomics and transcriptomics to define the gut environment after antibiotics and during the initial stages of C. difficile colonization and infection. We show that amino acids, in particular, proline and branched-chain amino acids, and carbohydrates decrease in abundance over time and that C. difficile gene expression is consistent with their utilization by the bacterium in vivo. We employed an integrated approach to analyze the metabolome and transcriptome to identify associations between metabolites and transcripts. This highlighted the importance of key nutrients in the early stages of colonization, and the data provide a rationale for the development of therapies based on the use of bacteria that specifically compete for nutrients that are essential for C. difficile colonization and disease.
Keywords: Clostridium difficile; amino acids; intestinal colonization; metabolomics; peptides; transcriptomics.
Figures


References
-
- Lucado J, Gould C, Elixhauser A. 2012. Clostridium difficile infections (CDI) in hospital stays. 2009: statistical brief no. 124. In Healthcare Cost and Utilization Project (HCUP) statistical briefs. Agency for Healthcare Research and Quality (US), Rockville, MD. - PubMed
-
- Lessa FC, Mu Y, Bamberg WM, Beldavs ZG, Dumyati GK, Dunn JR, Farley MM, Holzbauer SM, Meek JI, Phipps EC, Wilson LE, Winston LG, Cohen JA, Limbago BM, Fridkin SK, Gerding DN, McDonald LC. 2015. Burden of Clostridium difficile infection in the United States. N Engl J Med 372:825–834. doi: 10.1056/NEJMoa1408913. - DOI - PMC - PubMed
Publication types
MeSH terms
Substances
Grants and funding
LinkOut - more resources
Full Text Sources
Other Literature Sources
Molecular Biology Databases
