

The effect of hot days on occupational heat stress in the manufacturing industry: implications for workers' well-being and productivity
- PMID: 29600340
- PMCID: PMC6028887
- DOI: 10.1007/s00484-018-1530-6
The effect of hot days on occupational heat stress in the manufacturing industry: implications for workers' well-being and productivity
Abstract
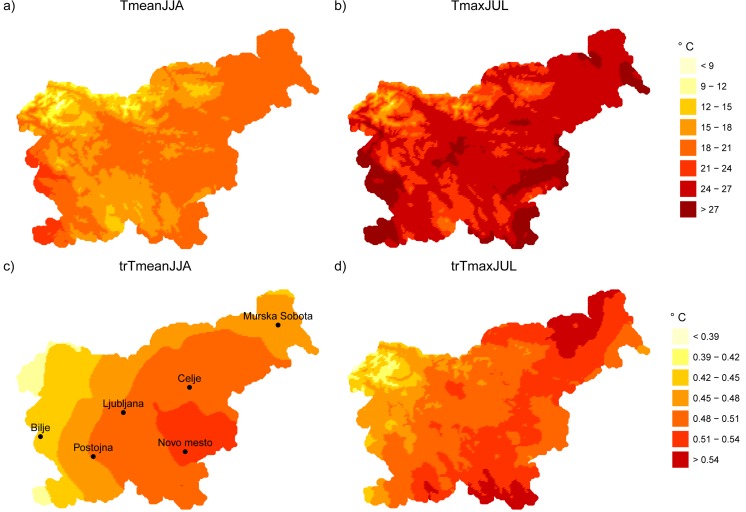
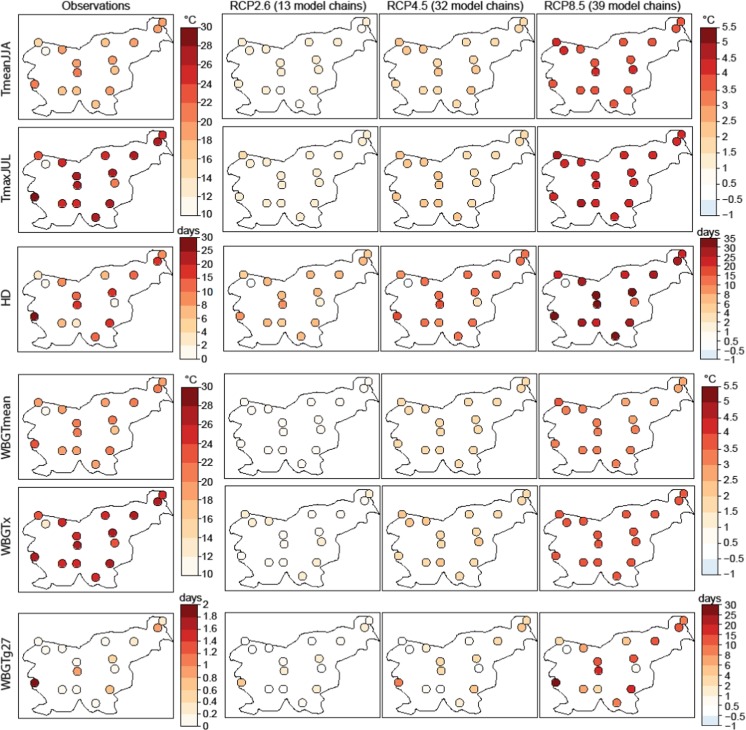
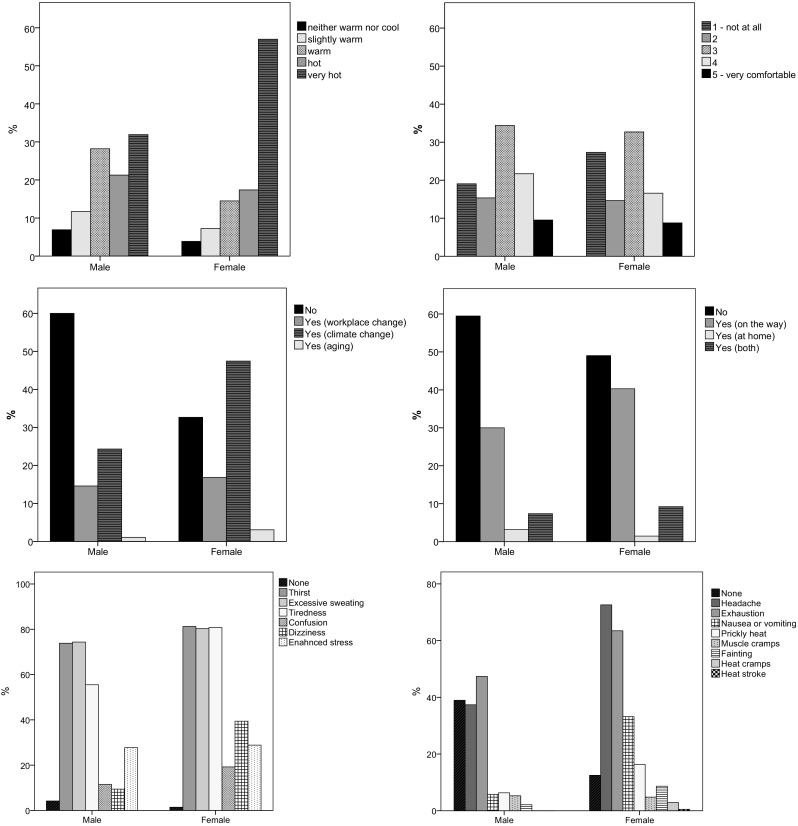
Climate change is expected to exacerbate heat stress at the workplace in temperate regions, such as Slovenia. It is therefore of paramount importance to study present and future summer heat conditions and analyze the impact of heat on workers. A set of climate indices based on summer mean (Tmean) and maximum (Tmax) air temperatures, such as the number of hot days (HD: Tmax above 30 °C), and Wet Bulb Globe Temperature (WBGT) were used to account for heat conditions in Slovenia at six locations in the period 1981-2010. Observed trends (1961-2011) of Tmean and Tmax in July were positive, being larger in the eastern part of the country. Climate change projections showed an increase up to 4.5 °C for mean temperature and 35 days for HD by the end of the twenty-first century under the high emission scenario. The increase in WBGT was smaller, although sufficiently high to increase the frequency of days with a high risk of heat stress up to an average of a third of the summer days. A case study performed at a Slovenian automobile parts manufacturing plant revealed non-optimal working conditions during summer 2016 (WBGT mainly between 20 and 25 °C). A survey conducted on 400 workers revealed that 96% perceived the temperature conditions as unsuitable, and 56% experienced headaches and fatigue. Given these conditions and climate change projections, the escalating problem of heat is worrisome. The European Commission initiated a program of research within the Horizon 2020 program to develop a heat warning system for European workers and employers, which will incorporate case-specific solutions to mitigate heat stress.
Keywords: Climate change; Heat stress; Hot day; Occupational health; Wet Bulb Globe Temperature.
Figures


Similar articles
-
Workers' health and productivity under occupational heat strain: a systematic review and meta-analysis.Lancet Planet Health. 2018 Dec;2(12):e521-e531. doi: 10.1016/S2542-5196(18)30237-7. Lancet Planet Health. 2018. PMID: 30526938
-
Assessment of Heat Stress Exposure among Construction Workers in the Hot Desert Climate of Saudi Arabia.Ann Work Expo Health. 2019 May 21;63(5):505-520. doi: 10.1093/annweh/wxz033. Ann Work Expo Health. 2019. PMID: 31051037 Free PMC article.
-
Site-specific hourly resolution wet bulb globe temperature reconstruction from gridded daily resolution climate variables for planning climate change adaptation measures.Int J Biometeorol. 2019 Jun;63(6):787-800. doi: 10.1007/s00484-019-01692-3. Epub 2019 Feb 23. Int J Biometeorol. 2019. PMID: 30798364
-
Climate change, workplace heat exposure, and occupational health and productivity in Central America.Int J Occup Environ Health. 2011 Jul-Sep;17(3):270-81. doi: 10.1179/107735211799041931. Int J Occup Environ Health. 2011. PMID: 21905396
-
Heat exposure in the Canadian workplace.Am J Ind Med. 2010 Aug;53(8):842-53. doi: 10.1002/ajim.20827. Am J Ind Med. 2010. PMID: 20623643 Review.
Cited by
-
Occupational Heat Stress and Practical Cooling Solutions for Healthcare and Industry Workers During the COVID-19 Pandemic.Ann Work Expo Health. 2020 Nov 16;64(9):915-922. doi: 10.1093/annweh/wxaa082. Ann Work Expo Health. 2020. PMID: 32955080 Free PMC article.
-
Heat and health of occupational workers: a short summary of literature.J Occup Health. 2024 Jan 4;66(1):uiae018. doi: 10.1093/joccuh/uiae018. J Occup Health. 2024. PMID: 38604180 Free PMC article. Review.
-
Heat Warnings in Switzerland: Reassessing the Choice of the Current Heat Stress Index.Int J Environ Res Public Health. 2019 Jul 27;16(15):2684. doi: 10.3390/ijerph16152684. Int J Environ Res Public Health. 2019. PMID: 31357581 Free PMC article.
-
Heat Waves Occurrence and Outdoor Workers' Self-assessment of Heat Stress in Slovenia and Greece.Int J Environ Res Public Health. 2019 Feb 19;16(4):597. doi: 10.3390/ijerph16040597. Int J Environ Res Public Health. 2019. PMID: 30791365 Free PMC article.
-
An Occupational Heat-Health Warning System for Europe: The HEAT-SHIELD Platform.Int J Environ Res Public Health. 2019 Aug 13;16(16):2890. doi: 10.3390/ijerph16162890. Int J Environ Res Public Health. 2019. PMID: 31412559 Free PMC article.
References
-
- Aggarwal A, Upadhyay R (2013) Thermoregulation. In: Heat stress and animal productivity. Springer, India. 10.1007/978-81-322-0879-2_1
-
- ARSO (2017) Podnebna spremenljivost Slovenije (PPS project): project reports and interactive portal on climate change in Slovenia, Slovenian Environment Agency. http://meteo.arso.gov.si/met/sl/climate/pss-project/. Accessed 30 Nov 2017
MeSH terms
LinkOut - more resources
Full Text Sources
Other Literature Sources
Medical
Molecular Biology Databases
