

Clinical Trajectories, Healthcare Resource Use, and Costs of Diabetic Nephropathy Among Patients with Type 2 Diabetes: A Latent Class Analysis
- PMID: 29600504
- PMCID: PMC5984913
- DOI: 10.1007/s13300-018-0410-8
Clinical Trajectories, Healthcare Resource Use, and Costs of Diabetic Nephropathy Among Patients with Type 2 Diabetes: A Latent Class Analysis
Abstract
Introduction: Patients with type 2 diabetes mellitus (T2DM) are clinically heterogeneous in terms of disease severity, treatment, and comorbidities, potentially resulting in differential diabetic nephropathy (DN) progression courses. In this exploratory study we used latent class analysis (LCA) to identify patient groups with distinct clinical profiles of T2DM severity and explored the association between disease severity, DN progression or reversal, and healthcare resource use (HRU) and costs.
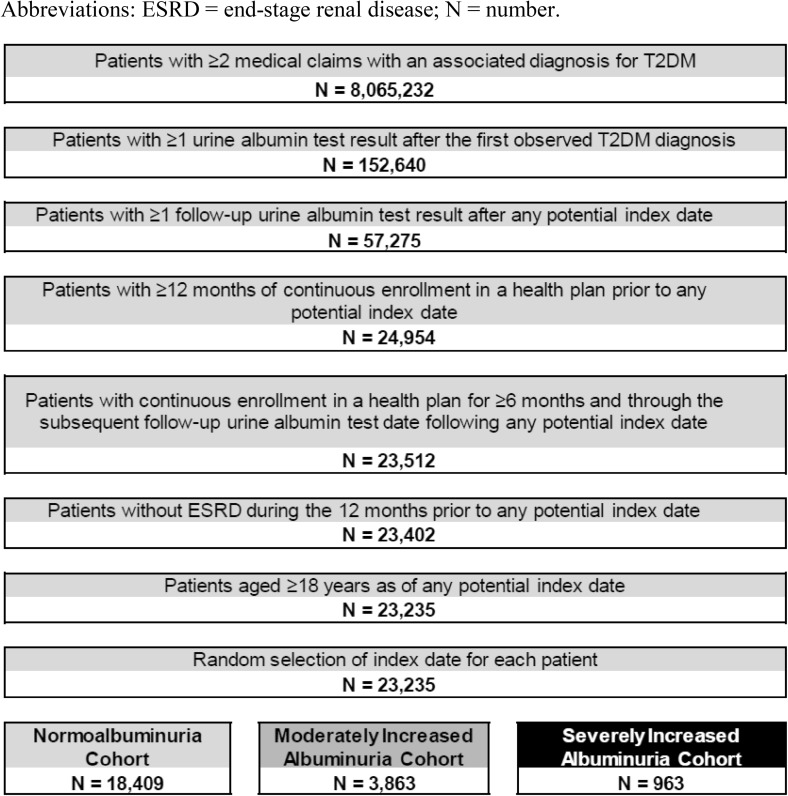
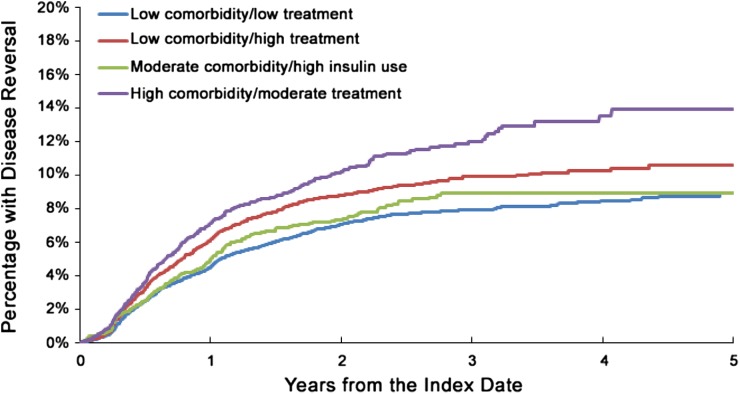
Methods: Latent class analysis was used to group adults with ≥ 2 medical claims with a diagnosis of T2DM and ≥ 2 urine albumin tests within the Truven MarketScan database (2004-2014), based on T2DM-related complications, comorbidities, and therapies. DN severity categories (normoalbuminuria, moderately increased albuminuria, and severely increased albuminuria) were determined based on urine albumin measure. The risks of DN progression and reversal (change to a more/less severe DN category) were compared among all identified latent classes using Kaplan-Meier analyses and log-rank tests. All-cause and DN-related costs and HRU were assessed and compared during the study period among the identified latent classes.
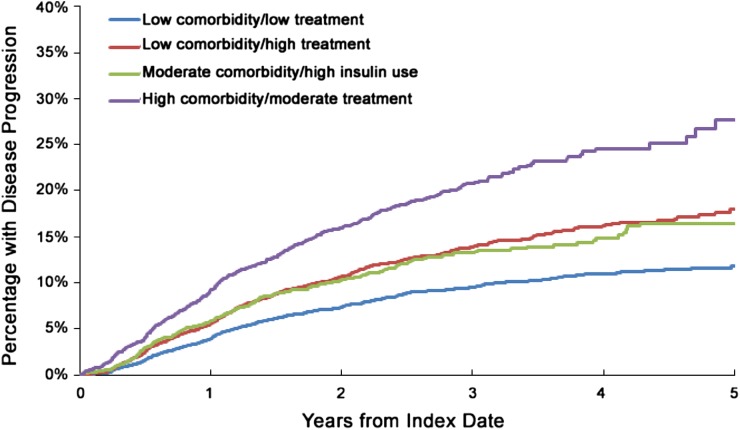
Results: Four clinically distinct profiles were identified among the 23,235 eligible patients: low comorbidity/low treatment (46.5%), low comorbidity/high treatment (29.0%), moderate comorbidity/high insulin use (9.7%), and high comorbidity/moderate treatment (14.8%). The 5-year DN progression rates for these clinically distinct profiles were 11.8, 18, 16.5, and 27.7%, respectively. Compared with the low comorbidity/low treatment group, all other groups were associated with an increased risk of DN progression (all p < 0.001). Increasing comorbidity was significantly associated with higher all-cause and DN-related HRU and costs, primarily driven by higher pharmacy and inpatient costs.
Conclusion: Patients with T2DM who have more comorbidities experienced higher rates of DN progression and HRU and incurred higher healthcare costs compared with patients with low comorbidity profiles. Future prospective studies are needed to confirm the significance of these groups on DN progression, HRU, and costs.
Funding: Takeda Development Center Americas, Inc.
Keywords: Clinical outcomes; Costs; Diabetic nephropathy; Healthcare resource use; Type 2 diabetes.
Figures
Similar articles
-
Healthcare Resource Use, Costs, and Disease Progression Associated with Diabetic Nephropathy in Adults with Type 2 Diabetes: A Retrospective Observational Study.Diabetes Ther. 2017 Jun;8(3):555-571. doi: 10.1007/s13300-017-0256-5. Epub 2017 Mar 30. Diabetes Ther. 2017. PMID: 28361464 Free PMC article.
-
Fracture risk and healthcare resource utilization and costs among osteoporosis patients with type 2 diabetes mellitus and without diabetes mellitus in Japan: retrospective analysis of a hospital claims database.BMC Musculoskelet Disord. 2016 Nov 25;17(1):489. doi: 10.1186/s12891-016-1344-9. BMC Musculoskelet Disord. 2016. PMID: 27887655 Free PMC article.
-
Drug usage patterns and treatment costs in newly-diagnosed type 2 diabetes mellitus cases, 2007 vs 2012: findings from a large US healthcare claims database analysis.J Med Econ. 2016 Jul;19(7):655-62. doi: 10.3111/13696998.2016.1151795. Epub 2016 Feb 26. J Med Econ. 2016. PMID: 26855139
-
The need for early predictors of diabetic nephropathy risk: is albumin excretion rate sufficient?Diabetes. 2000 Sep;49(9):1399-408. doi: 10.2337/diabetes.49.9.1399. Diabetes. 2000. PMID: 10969821 Review.
-
Diagnostic Accuracy of Neutrophil Gelatinase-Associated Lipocalin for Predicting Early Diabetic Nephropathy in Patients with Type 1 and Type 2 Diabetes Mellitus: A Systematic Review and Meta-analysis.J Appl Lab Med. 2019 Jul;4(1):78-94. doi: 10.1373/jalm.2018.028530. Epub 2019 Mar 1. J Appl Lab Med. 2019. PMID: 31639710
Cited by
-
Differential Health Care Use, Diabetes-Related Complications, and Mortality Among Five Unique Classes of Patients With Type 2 Diabetes in Singapore: A Latent Class Analysis of 71,125 Patients.Diabetes Care. 2020 May;43(5):1048-1056. doi: 10.2337/dc19-2519. Epub 2020 Mar 18. Diabetes Care. 2020. PMID: 32188774 Free PMC article.
-
Identification of Ferroptosis-related Genes for Diabetic Nephropathy by Bioinformatics and Experimental Validation.Curr Pharm Des. 2025;31(20):1633-1662. doi: 10.2174/0113816128349101250102113613. Curr Pharm Des. 2025. PMID: 39865825
-
Population segmentation of type 2 diabetes mellitus patients and its clinical applications - a scoping review.BMC Med Res Methodol. 2021 Mar 11;21(1):49. doi: 10.1186/s12874-021-01209-w. BMC Med Res Methodol. 2021. PMID: 33706717 Free PMC article.
References
-
- Chen J. Diabetic nephropathy: scope of the problem. In: Lerma EV, Batuman V, editors. Diabetes and Kidney Disease. Heidelberg: Springer; 2014. pp. 1–14.
-
- Kim JJ, Hwang BH, Choi IJ, et al. A prospective two-center study on the associations between microalbuminuria, coronary atherosclerosis and long-term clinical outcome in asymptomatic patients with type 2 diabetes mellitus: evaluation by coronary CT angiography. Int J Cardiovasc Imaging. 2015;31:193–203. doi: 10.1007/s10554-014-0541-6. - DOI - PubMed
LinkOut - more resources
Full Text Sources
Other Literature Sources
Research Materials
