. 2018 Jun;12(5):390-406.
doi: 10.1080/17435390.2018.1457189. Epub 2018 Mar 30.

Titanium dioxide nanoparticle exposure alters metabolic homeostasis in a cell culture model of the intestinal epithelium and Drosophila melanogaster

Affiliations

Titanium dioxide nanoparticle exposure alters metabolic homeostasis in a cell culture model of the intestinal epithelium and Drosophila melanogaster

Jonathan W Richter et al. Nanotoxicology. 2018 Jun.

Abstract

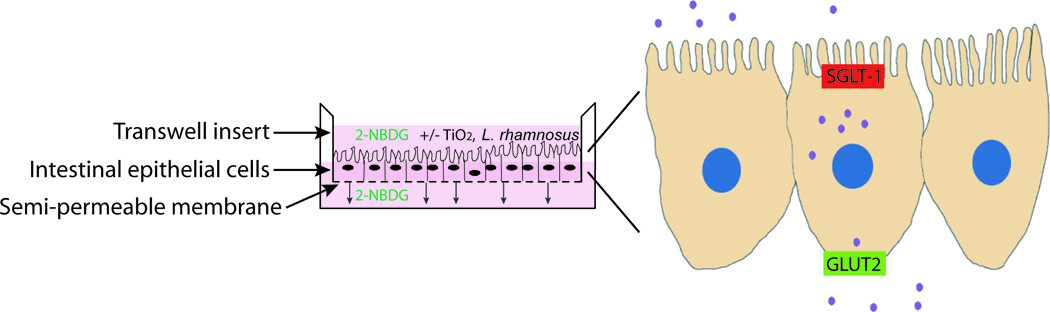
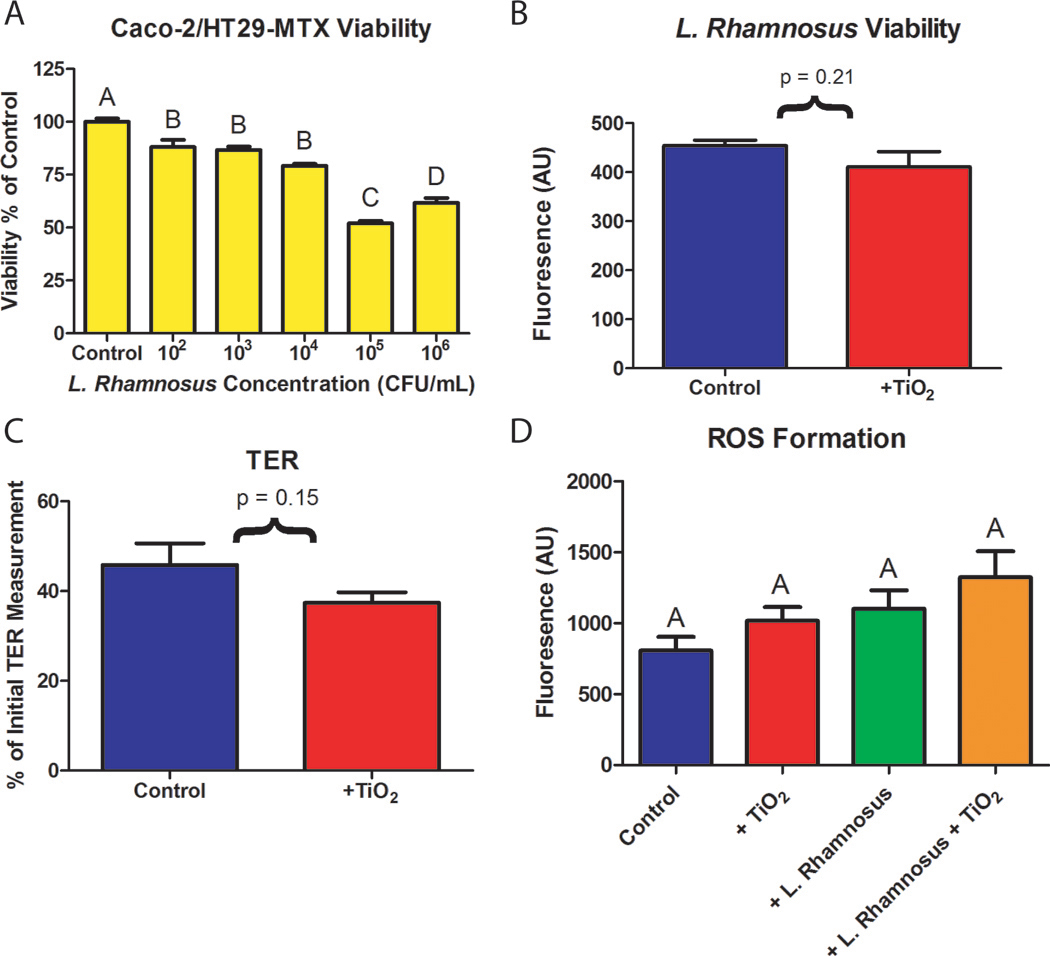
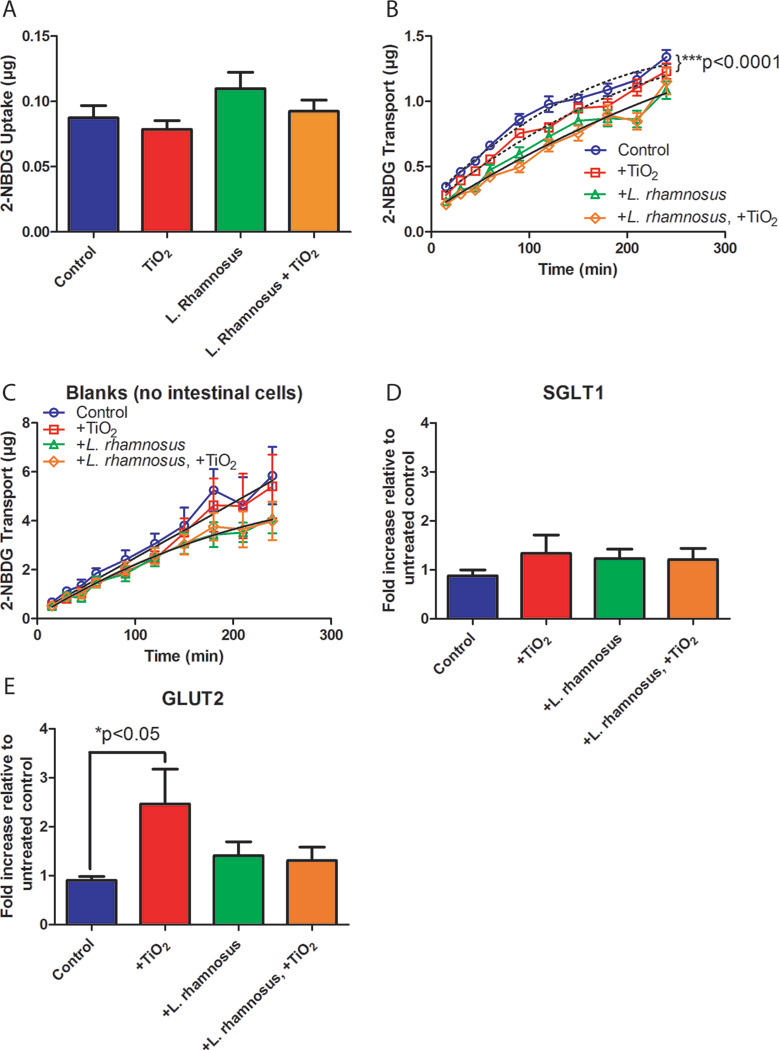
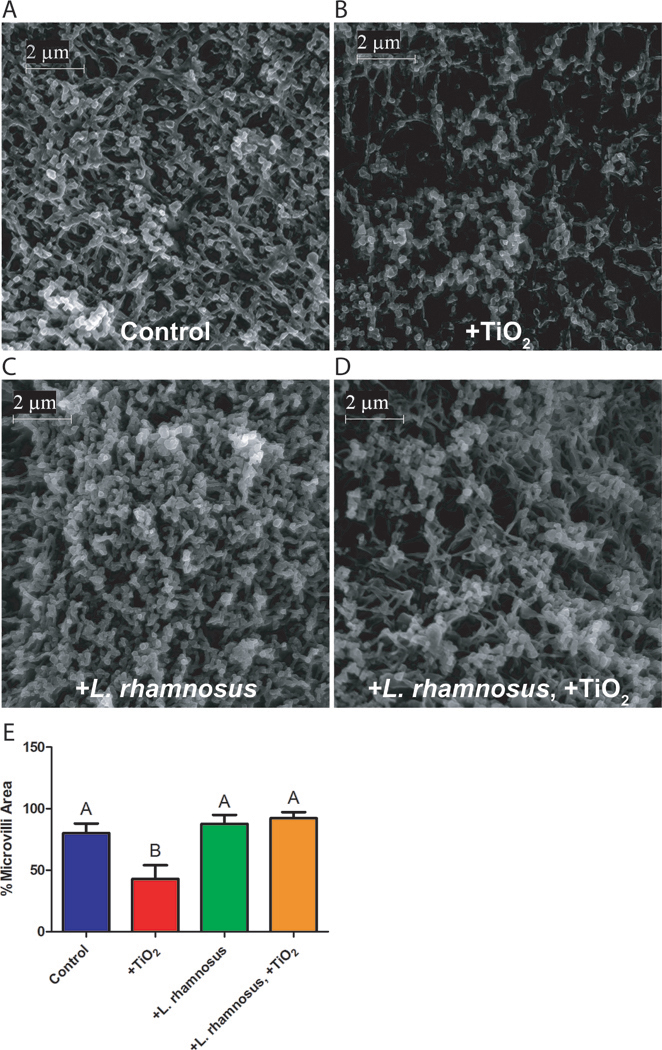
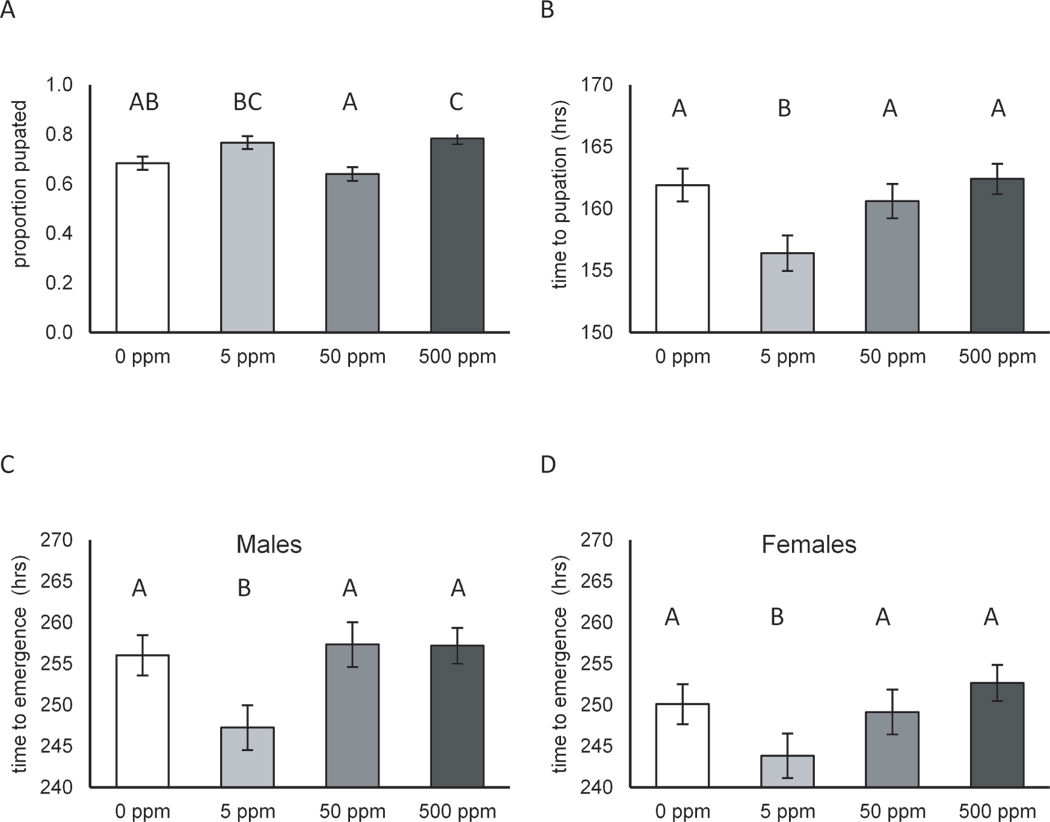
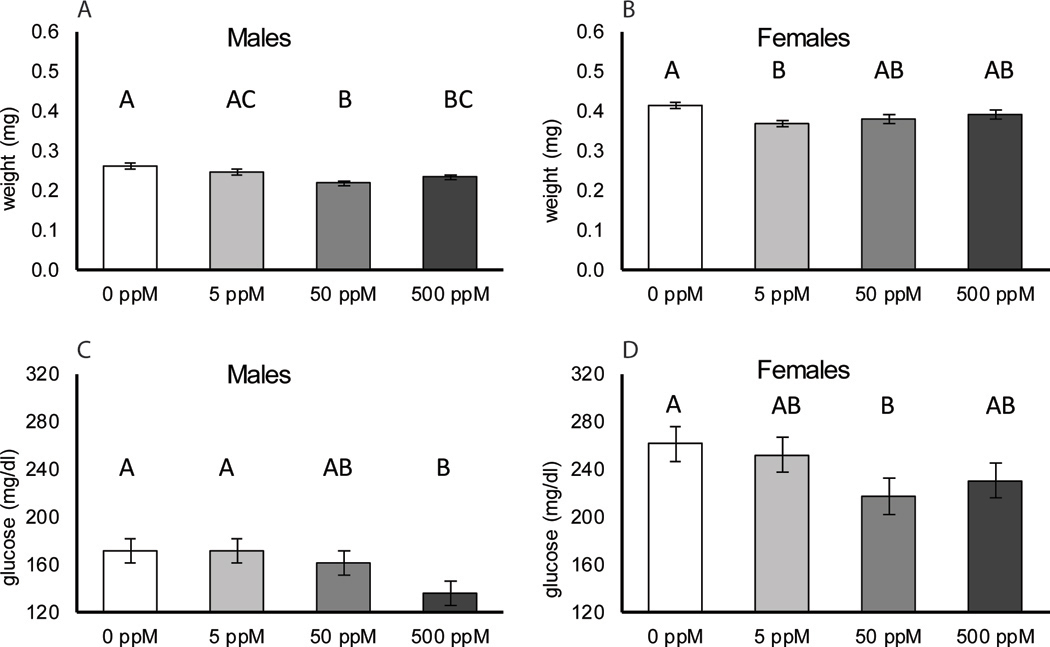
Nanosized titanium dioxide (TiO2) is a common additive in food and cosmetic products. The goal of this study was to investigate if TiO2 nanoparticles affect intestinal epithelial tissues, normal intestinal function, or metabolic homeostasis using in vitro and in vivo methods. An in vitro model of intestinal epithelial tissue was created by seeding co-cultures of Caco-2 and HT29-MTX cells on a Transwell permeable support. These experiments were repeated with monolayers that had been cultured with the beneficial commensal bacteria Lactobacillus rhamnosus GG (L. rhamnosus). Glucose uptake and transport in the presence of TiO2 nanoparticles was assessed using fluorescent glucose analog 2-(N-(7-nitrobenz-2-oxa-1,3-diazol-4-yl)amino)-2-deoxyglucose (2-NBDG). When the cell monolayers were exposed to physiologically relevant doses of TiO2, a statistically significant reduction in glucose transport was observed. These differences in glucose absorption were eliminated in the presence of beneficial bacteria. The decrease in glucose absorption was caused by damage to intestinal microvilli, which decreased the surface area available for absorption. Damage to microvilli was ameliorated in the presence of L. rhamnosus. Complimentary studies in Drosophila melanogaster showed that TiO2 ingestion resulted in decreased body size and glucose content. The results suggest that TiO2 nanoparticles alter glucose transport across the intestinal epithelium, and that TiO2 nanoparticle ingestion may have physiological consequences.

Keywords: Caco-2; GI tract; Lactobacillus rhamnosus; glucose; microbiome.


Figures

Figure 1.
Figure 1.
In vitro model of intestinal epithelium. Co-cultures of absorptive (Caco-2) and mucus producing (HT29-MTX) intestinal epithelial cells are seeded on a semi-permeable membrane and grown until confluent. The top chamber represents the lumen of the small intestine while the bottom chamber represents the bloodstream. 2-NBDG transport from the top to the bottom chamber represents transport of glucose into the body. Expanded view of cells shows apical and basolateral glucose transporters.
Figure 2.
Figure 2.
(A) Intestinal epithelial cell viability. Co-cultures of Caco-2 and HT29-MTX were grown for 14 days and exposed to varying concentrations of L. rhamnosus in DMEM for four hours. After a 4 hour exposure to L. rhamnosus, mammalian cell viability was significantly decreased for all concentrations of bacteria tested. Standard errors and Tukey groups are shown, n = 6. (B) L. rhamnosus viability. 103 CFU/mL L. rhamnosus in DMEM containing 1.4×10⁻⁴ mg/mL 30nm TiO2 nanoparticles were added to the top chamber of Caco-2/HT29-MTX intestinal cultures. After four hours, the viability of L. rhamnosus was not significantly decreased according to a student’s t test, t(16) = 1.30, p = 0.21, Standard errors are shown. (C) Representative transepithelial resistance (TER) measurements of cell monolayers before and after a four hour exposure to 1×10⁻⁴ mg/mL TiO2 nanoparticles. Data is presented as a percentage of TER measurements made in the same wells before and after the nanoparticle exposure and glucose transport experiments. Data is provided as a mean ± SEM (n = 5), results were not significantly different according to an upaired student’s t-test ( p > 0.05). (D) Reactive oxygen species (ROS) formation. Fluorescence resulting from CellROX dye in controls or following a four hour exposure to 1×10⁻⁴ mg/mL TiO2 naoparticles, 103 CFU/mL L. rhamnosus, or both 1×10⁻⁴ mg/mL TiO2 and 103 CFU/mL L. rhamnosus. No statistical difference was found between treatments according to a one-way ANOVA (p > 0.05). Data is provided as a mean ± SEM (n = 6).
Figure 3.
Figure 3.
Glucose analog (2-NBDG) uptake (A) and transport (B, C) and glucose transporter gene expression (D, E). (A) 2-NBDG uptake into intestinal epithelial cells is not significantly altered after a four hour exposure to 1.4×10⁻⁴ mg/mL 30nm TiO2 nanoparticles (n=22), 103 CFU/mL L. rhamnosus (n=25), or 1.4×10⁻⁴ mg/mL TiO2 nanoparticles and 103 CFU/mL L. rhamnosus (n = 25) when compared with untreated controls according to a one-way ANOVA, p = 0.16. Standard errors are shown. (B) 2-NBDG transport across the in vitro intestinal epithelium model following exposure to exposure to 1.4×10⁻⁴ mg/mL 30nm TiO2 nanoparticles, L. rhamnosus, or 1.4×10⁻⁴ mg/mL TiO2 nanoparticles and L. rhamnosus. Glucose transport was significantly decreased following exposure to nanoparticles when compared with untreated controls (n=72 across 6 transport experiments, p< 0.0001), but is not significantly changed with nanoparticle exposure in the presence of beneficial bacteria (n=60, across 5 transport experiments, p = 0.64). Curve fits (dotted or solid black lines) were compared using the AICs from a quadratic model. (C) 2-NBDG transport across blank membranes following exposure to 1.4×10⁻⁴ mg/mL 30nm TiO2 nanoparticles, L. rhamnosus, or 1.4×10⁻⁴ mg/mL TiO2 nanoparticles and L. rhamnosus. Glucose transport was not significantly decreased following exposure to nanoparticles when compared with untreated controls (p = 0.87) and was not significantly changed with nanoparticle exposure in the presence of beneficial bacteria (p = 0.96). Curve fits were compared using the AICs from a quadratic model. (D, E) Gene expression of glucose transporters model following exposure to exposure to 1.4×10⁻⁴ mg/mL 30nm TiO2 nanoparticles, L. rhamnosus, or 1.4×10⁻⁴ mg/mL TiO2 nanoparticles and L. rhamnosus. Expression of the apical glucose transporter SGLT1 is not significantly altered following a four hour exposure to nanoparticles or bacteria according to a one-way ANOVA (p > 0.05). The basolateral glucose transporter GLUT2 expression is significantly increased with exposure to nanoparticles only in the absence of bacteria (p<0.05). Standard error is shown.
Figure 4.
Figure 4.
Scanning Electron Microscopy. Images show unexposed controls (A), or cells following a four hour exposure to 1.4×10⁻⁴ mg/mL 30nm TiO2 nanoparticles (B), 103 CFU/mL L. rhamnosus (C), or 1.4×10⁻⁴ mg/mL TiO2 nanoparticles and 103 CFU/mL L. rhamnosus (D). Scale bars are 2 μm (magnification 20K). (E) ImageJ was used to quantify the percent area covered by microvilli (n = 6). Cells exposed to TiO2 nanoparticles showed a significant decrease in microvilli according to a one-way ANOVA (p < 0.05). Standard error and Tukey groups are shown.
Figure 5.
Figure 5.
Developmental traits including proportion pupated, mean time to pupation, and mean time to emergency for male and female Drosophila melanogaster (D. melanogaster) instar larvae exposed to 5, 50, or 500 ppm 30 nm TiO2 nanoparticles (NP) suspended within food. Shown are the proportion pupated (A), mean time to pupation in hours (B) and mean time to emergence in hours for males (C) and females (D). Thirty first instar larvae were collected from grape plates without TiO2 NP and haphazardly allocated to the four different TiO2 treatments where they were allowed to develop. Ten replicate vials of each concentration (each with 30 larvae) were used to measure developmental traits. Standard errors and Tukey groups are indicated above each treatment.
Figure 6.
Figure 6.
Wet body weight, protein and glucose concentrations for male and female Drosophila melanogaster (D. melanogaster) exposed to 5, 50, or 500 ppm 30 nm TiO2 nanoparticles (NP) suspended within food. Mean dry weight (mg) with standard errors for males (A) and females (B) across the four different TiO2 nanoparticle concentrations. Mean glucose concentrations with standard errors for males (C) and females (D) across the four different TiO2 nanoparticle concentrations. Tukey groupings are indicated above each treatment.

References

    1. Lomer MCE, Thompson RPH and Powell JJ. 2002. Fine and ultrafine particles of the diet: influence on the mucosal immune response and association with Crohn’s disease. Proceedings of the Nutrition Society 61:123–130. - PubMed
    1. Weir A, Westerhoff P, Fabricius L, Hristovski K and von Goetz N. 2012. Titanium Dioxide Nanoparticles in Food and Personal Care Products. Environ Sci Technol 46:2242–2250. - PMC - PubMed
    1. Robichaud CO, Uyar AE, Darby MR, Zucker LG and Wiesner MR. 2009. Estimates of upper bounds and trends in nano-TiO2 production as a basis for exposure assessment. Environ Sci Technol 43:4227–4233. - PubMed
    1. Xia T, Li N and Nel AE. 2009. Potential health impact of nanoparticles. Annu Rev Public Health 30:137–150. - PubMed
    1. Maynard AD. 2006. Nanotechnology: assessing the risks. Nano Today 1:22–33.

Publication types