. 2018 Jul 1;315(1):H109-H121.
doi: 10.1152/ajpheart.00034.2018. Epub 2018 Mar 30.

Human muscle-specific A-kinase anchoring protein polymorphisms modulate the susceptibility to cardiovascular diseases by altering cAMP/PKA signaling

Affiliations

Human muscle-specific A-kinase anchoring protein polymorphisms modulate the susceptibility to cardiovascular diseases by altering cAMP/PKA signaling

Santosh V Suryavanshi et al. Am J Physiol Heart Circ Physiol. .

Erratum in

  • Corrigendum.
    [No authors listed] [No authors listed] Am J Physiol Heart Circ Physiol. 2019 Feb 1;316(2):H432. doi: 10.1152/ajpheart.zh4-2504-corr.2019. Am J Physiol Heart Circ Physiol. 2019. PMID: 30715904 Free PMC article. No abstract available.

Abstract

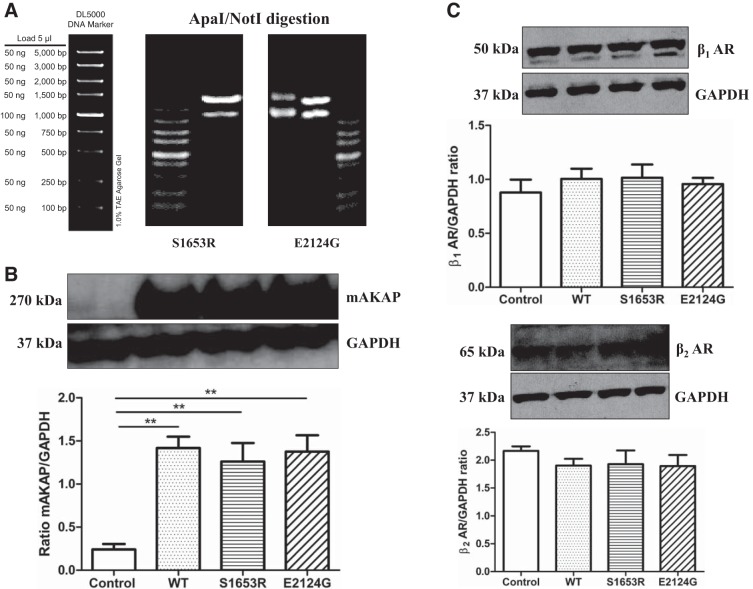
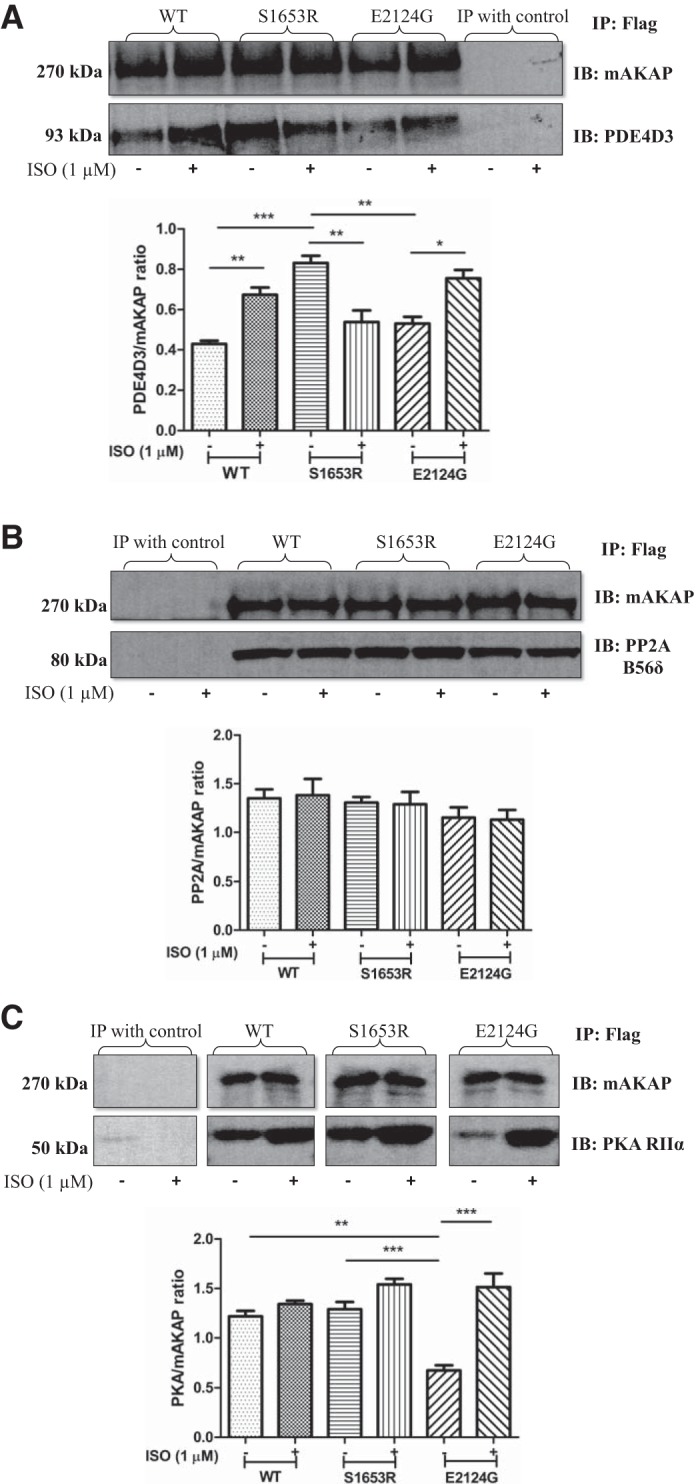
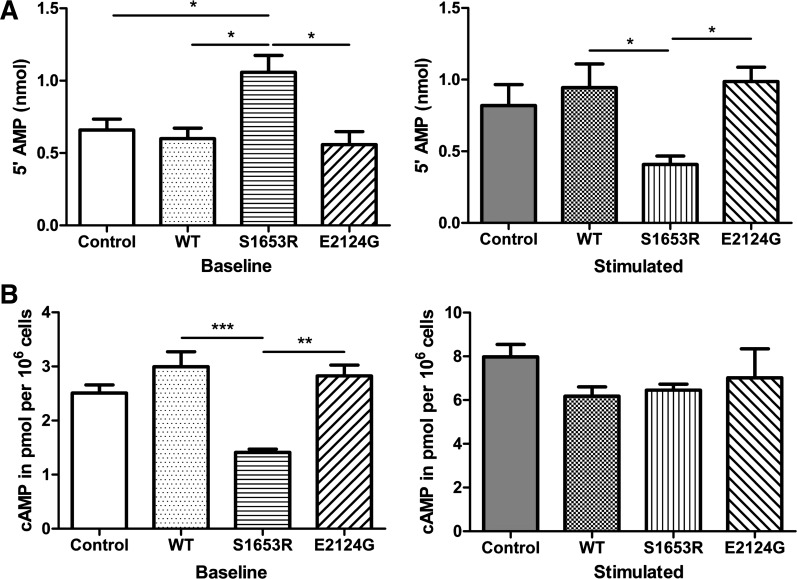
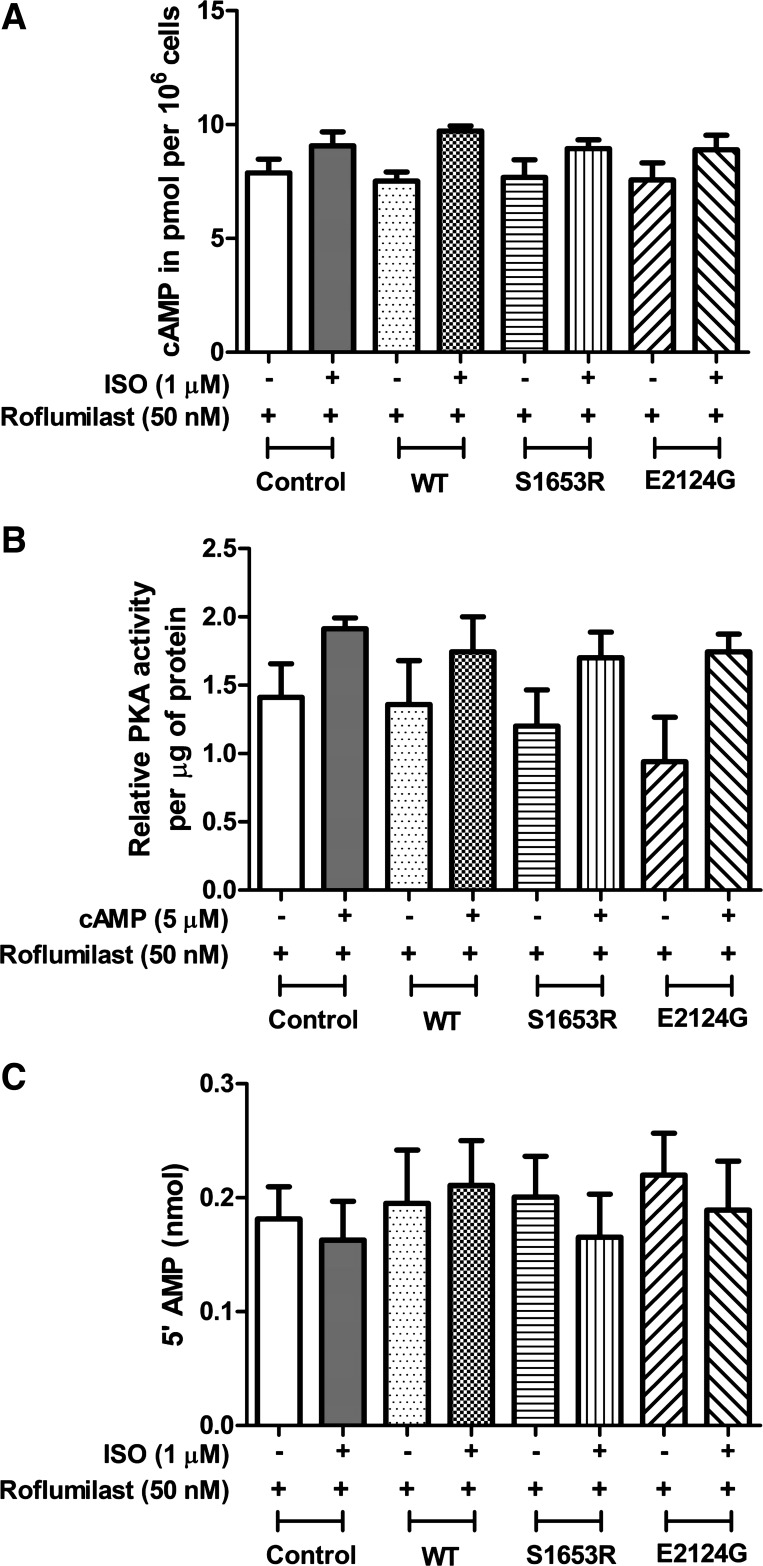
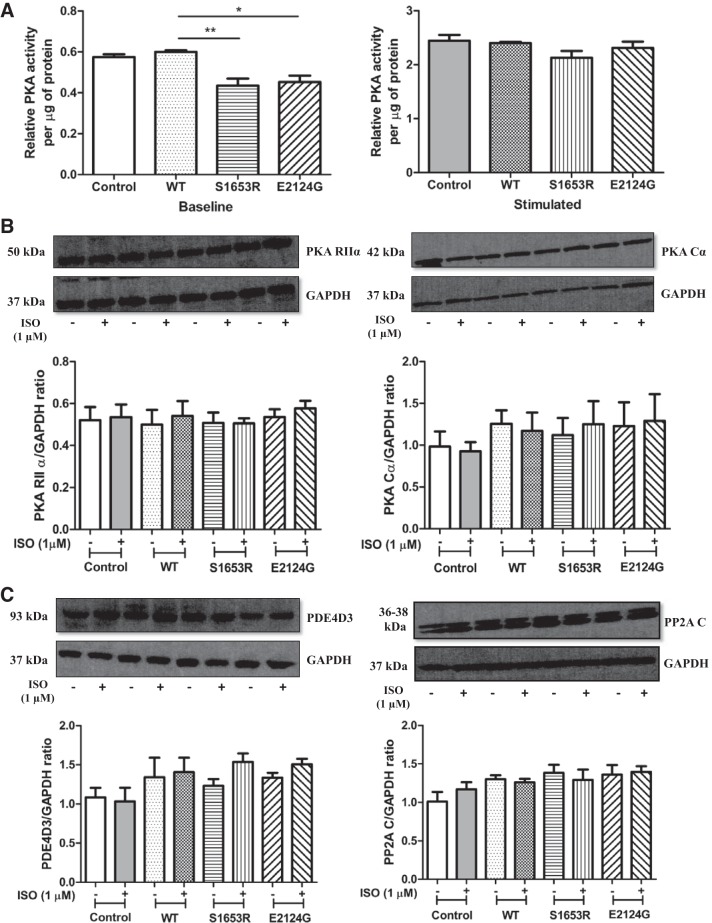
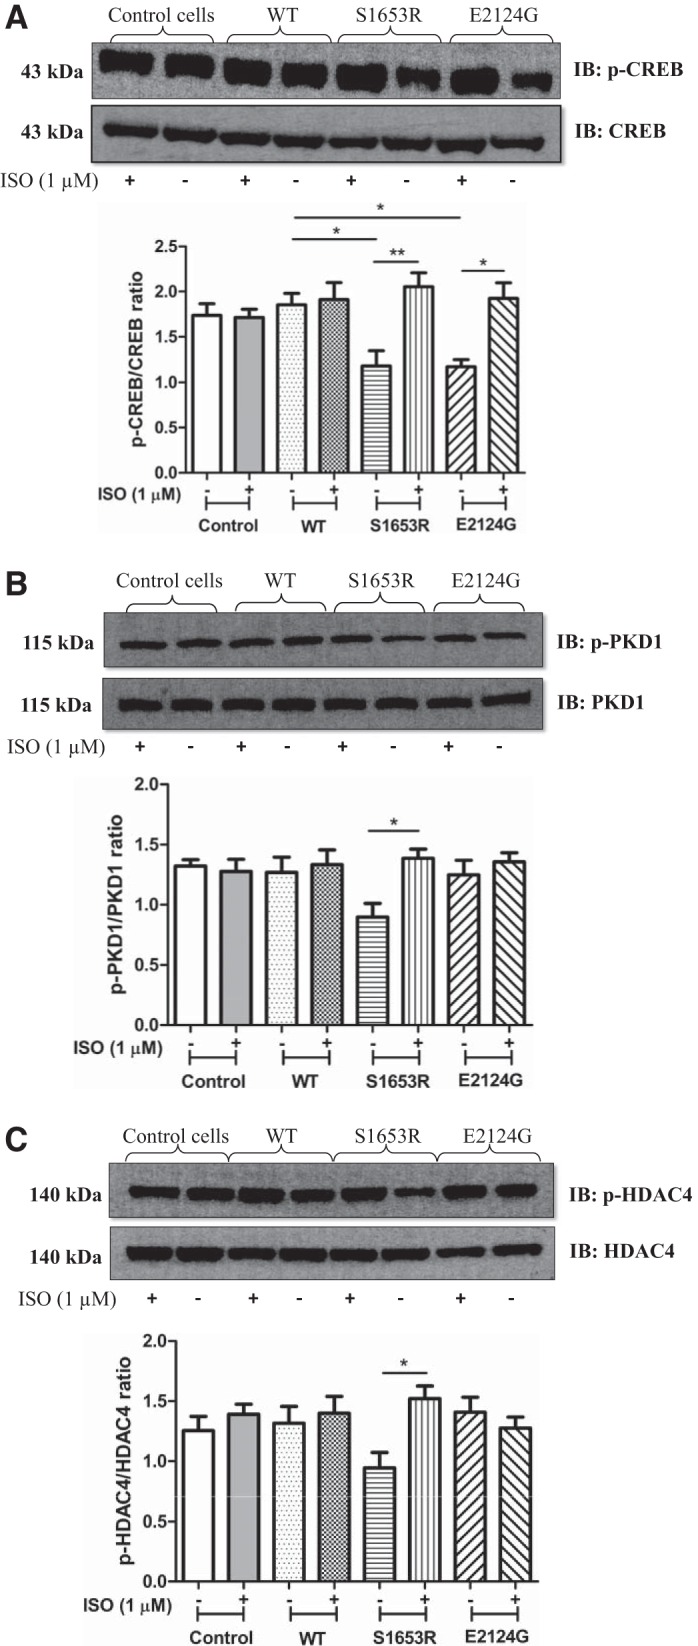
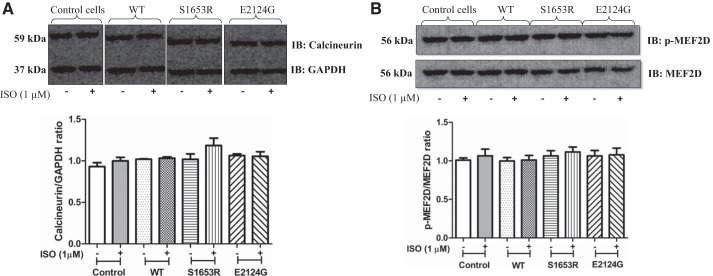
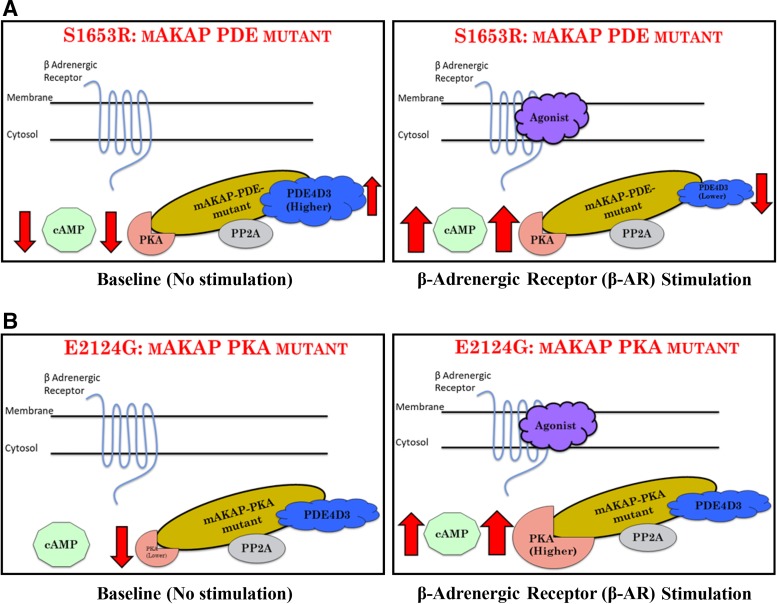
One of the crucial cardiac signaling pathways is cAMP-mediated PKA signal transduction, which is regulated by a family of scaffolding proteins, i.e., A-kinase anchoring proteins (AKAPs). Muscle-specific AKAP (mAKAP) partly regulates cardiac cAMP/PKA signaling by binding to PKA and phosphodiesterase 4D3 (PDE4D3), among other proteins, and plays a central role in modulating cardiac remodeling. Moreover, genetics plays an incomparable role in modifying the risk of cardiovascular diseases (CVDs). Single-nucleotide polymorphisms (SNPs) in various proteins have especially been shown to predispose individuals to CVDs. Hence, we hypothesized that human mAKAP polymorphisms found in humans with CVDs alter the cAMP/PKA pathway, influencing the susceptibility of individuals to CVDs. Our computational analyses revealed two mAKAP SNPs found in cardiac disease-related patients with the highest predicted deleterious effects, Ser 1653 Arg (S1653R) and Glu 2124 Gly (E2124G). Coimmunoprecipitation data in human embryonic kidney-293T cells showed that the S1653R SNP, present in the PDE4D3-binding domain of mAKAP, changed the binding of PDE4D3 to mAKAP and that the E2124G SNP, flanking the 3'-PKA binding domain, changed the binding of PKA before and after stimulation with isoproterenol. These SNPs significantly altered intracellular cAMP levels, global PKA activity, and cytosolic PDE activity compared with the wild type before and after isoproterenol stimulation. PKA-mediated phosphorylation of pathological markers was found to be upregulated after cell stimulation in both mutants. In conclusion, human mAKAP polymorphisms may influence the propensity of developing CVDs by affecting cAMP/PKA signaling, supporting the clinical significance of PKA-mAKAP-PDE4D3 interactions. NEW & NOTEWORTHY We found that single-nucleotide polymorphisms in muscle-specific A-kinase anchoring protein found in human patients with cardiovascular diseases significantly affect the cAMP/PKA signaling pathway. Our results showed, for the first time, that human muscle-specific A-kinase anchoring protein polymorphisms might alter the susceptibility of individuals to develop cardiovascular diseases with known underlying molecular mechanisms.


Figures

Fig. 1.
Fig. 1.
S1653R and E2124G human in muscle-specific A-kinase anchoring protein (mAKAP) single-nucleotide polymorphisms (SNPs) were successfully created by site-directed mutagenesis, and both mutants did not alter mAKAP expression along with β1- and β2-adrenergic receptors (β1- and β2-ARs). A: double digestion of mutated plasmids by the restriction enzymes ApaI and NotI with only two expected bands and no other contaminating bands on 1% Tris-acetate-EDTA gels, as provided by Biomatik. The DNA marker shows the corresponding molecular weight of DNA (in bp). B: representative Western blots showing mAKAP and GAPDH bands and quantification of the same using one-way ANOVA with Tukey’s multiple-comparison test. Three independent experiments (n = 3) of human embryonic kidney (HEK)-293T cell lysates were analyzed, and data are expressed as means ± SE. **P < 0.01 vs. control untransfected cells [control: 0.2409 ± 0.06368; wild type (WT): 1.417 ± 0.1330; S1653R: 1.261 ± 0.2145; E2124G: 1.375 ± 0.1905]. C: representative Western blots for β1- and β2-ARs along with GAPDH and quantification by one-way ANOVA with Tukey’s multiple-comparison test. Four independent experiments (n = 4) were performed, and data are expressed as means ± SE: β1-AR (control: 0.8779 ± 0.1198; WT: 1.005 ± 0.09496; S1653R: 1.015 ± 0.1226; E2124G: 0.9573 ± 0.05715) and β2-AR (control: 2.166 ± 0.08062; WT: 1.903 ± 0.1221; S1653R: 1.927 ± 0.2458; E2124G: 1.894 ± 0.1986).
Fig. 2.
Fig. 2.
Human muscle-specific A-kinase anchoring protein (mAKAP) polymorphisms alter the binding of mAKAP to phosphodiesterase 4D3 (PDE4D3) and PKA both before and after stimulation with isoproterenol (ISO) in human embryonic kidney-293T cells. A: representative immunoblots of equal amounts of Flag-immunoprecipitated samples immunoblotted with PDE4D3 and mAKAP antibodies. A quantification of the four independent experiments is shown. Data are expressed as means ± SE [wild-type (WT) (−): 0.4294 ± 0.01563; WT (+): 0.6740 ± 0.03602; S1653R (−): 0.8312 ± 0.03568; S1653R (+): 0.5389 ± 0.05761; E2124G (−): 0.5313 ± 0.03342; and E2124G (+): 0.7554 ± 0.04143]. B: representative immunoblot Flag-immunoprecipitated samples showing bands for PKA RIIα and mAKAP antibodies. The corresponding quantification of four independent replicates by one-way ANOVA with Tukey’s multiple-comparison test is shown. Data are expressed as means ± SE [WT (−): 1.220 ± 0.05473; WT (+): 1.343 ± 0.03416; S1653R (−): 1.291 ± 0.07361; S1653R (+): 1.542 ± 0.05610; E2124G (−): 0.6783 ± 0.05108; E2124G (+): 1.514 ± 0.1369]. C: representative immunoblots of Flag-immunoprecipitated samples immunoblotted with hemagglutinin tag and mAKAP antibodies. The quantification of four separate experiments was performed by one-way ANOVA with Tukey’s multiple-comparison test (P = 0.5413) [WT (−): 1.351 ± 0.09165; WT (+): 1.382 ± 0.1681; S1653R (−): 1.305 ± 0.05912; S1653R (+): 1.290 ± 0.1259; E2124G (−): 1.153 ± 0.1054; E2124G (+): 1.131 ± 0.09952]. In AC, cells were stimulated with ISO (1 µM) for 10 min (+), and unstimulated cells were treated with DMSO for 10 min (−). *P < 0.05; **P < 0.01; ***P < 0.001. IB, immunoblot analysis; IP, immunoprecipitation; PP2A, protein phosphatase 2A.
Fig. 3.
Fig. 3.
S1653R muscle-specific A-kinase anchoring protein single-nucleotide polymorphism changes cytosolic phosphodiesterase (PDE) activity and intracellular cAMP levels before and after isoproterenol (ISO) stimulation in human embryonic kidney-293T cells. A: PDE activity of cytosolic fractions was measured by calculating nanomoles of 5′-AMP released using colorimetry at 620 nm: baseline [control: 0.6588 ± 0.07612; wild-type (WT): 0.5998 ± 0.07175; S1653R: 1.059 ± 0.1156; E2124G: 0.5701 ± 0.08640] and stimulated (control: 0.8188 ± 0.1473; WT: 0.9443 ± 0.1654; S1653R: 0.4076 ± 0.05919; E2124G: 0.9869 ± 0.1004). B: free intracellular cAMP levels were calculated by measuring the absorbance at 405 nm: baseline (control: 2.510 ± 0.1480; WT: 2.995 ± 0.2767; S1653R: 1.413 ± 0.05879; E2124G: 2.825 ± 0.1995) and stimulated (control: 7.983 ± 0.5658; WT: 6.178 ± 0.4226; S1653R: 6.458 ± 0.2745; E2124G: 7.020 ± 1.324). In A and B, each sample was measured three times, and the average was taken as one experiment. Four separate experiments (n = 4) were performed for each group, and data are expressed as means ± SE. One-way ANOVA with Tukey’s multiple-comparison test was used for the analysis. *P < 0.05; **P < 0.01; ***P < 0.001. In A and B, cells were pretreated with ISO (1 µM) for 10 min (stimulation), and unstimulated cells were treated with DMSO for 10 min (baseline).
Fig. 4.
Fig. 4.
Roflumilast treatment showed no change in cAMP levels, PKA activity, or phosphodiesterase (PDE) activity either before or after isoproterenol stimulation. A: cells were pretreated with roflumilast (selective PDE4 inhibitor, 50 nM) for 15 min followed by DMSO (−) or isoproterenol (ISO) (+) treatment for 10 min. Four independent experiments were used to analyze the data, where each reading of an experiment is an average of three technical replicates, and data are expressed as means ± SE [control (−): 7.888 ± 0.5883; control (+): 9.063 ± 0.6162; wild-type (WT) (−): 7.515 ± 0.3998; WT (+): 9.715 ± 0.2228; S1653R (−): 7.683 ± 0.7788; S1653R (+): 8.948 ± 0.3886; E2124G (−): 7.573 ± 0.7420; E2124G (+): 8.898 ± 0.6284]. B: cells were pretreated with roflumilast (selective PDE4 inhibitor, 50 nM) for 15 min before cell lysis. Cells were then given no treatment (−) or treated with cAMP (+; 5 µM) for 10 min before PKA activity was measured. Four independent experiments were used to analyze the data, where each reading of an experiment is an average of three technical replicates, and data are expressed as means ± SE [control (−): 1.411 ± 0.2452; control (+): 1.914 ± 0.07938; WT (−): 1.360 ± 0.3208; WT (+): 1.745 ± 0.2556; S1653R (−): 1.201 ± 0.2641; S1653R (+): 1.700 ± 0.1890; E2124G (−): 0.9401 ± 0.3261; E2124G (+): 1.745 ± 0.1297]. C: cells were pretreated with roflumilast (selective PDE4 inhibitor; 50 nM) for 15 min followed by DMSO (−) or ISO (+) treatment for 10 min. Four independent experiments were used to analyze the data, where each reading of an experiment is an average of three technical replicates, and data are expressed as means ± SE [control (−): 0.1813 ± 0.02838; control (+): 0.1628 ± 0.03394; WT (−): 0.1952 ± 0.04658; WT (+): 0.2108 ± 0.03931; S1653R (−): 0.2006 ± 0.03572; S1653R (+): 0.1653 ± 0.03781; E2124G (−): 0.2199 ± 0.03684; E2124G (+): 0.1891 ± 0.04315].
Fig. 5.
Fig. 5.
S1653R and E2124G muscle-specific A-kinase anchoring protein single-nucleotide polymorphisms abruptly affect global PKA activity before and after stimulation, with no endogenous changes in PKA, phosphodiesterase 4D3 (PDE4D3), or protein phosphatase 2A (PP2A). A: total PKA activity was calculated by quantifying the color developed at the end of the assay by measuring the absorbance at 450 nm. Baseline, no pretreatment; stimulation, cell treatment with cAMP (5 µM) for 10 min at 37°C after the cell lysis. Three independent experiments (n = 3) were performed for this assay, where each experiment was calculated as an average of three replicates of readings, and values are expressed as means ± SE: baseline [control: 0.5741 ± 0.01450; wild-type (WT): 0.5994 ± 0.007568; S1653R: 0.4352 ± 0.03462; E2124G: 0.4527 ± 0.03182] and stimulated (control: 2.445 ± 0.1103; WT: 2.402 ± 0.02461; S1653R: 2.129 ± 0.1279; E2124G: 2.312 ± 0.1181). B: representative immunoblots of PKA RIIα and PKA-Cα along with their respective GAPDH and quantification bar graphs of four independent experiments: PKA RIIα [control (−): 0.5207 ± 0.06271; control (+): 0.5357 ± 0.05975; WT (−): 0.5003 ± 0.06987; WT (+): 0.5411 ± 0.07028; S1653R (−): 0.5077 ± 0.05017; S1653R (+): 0.5054 ± 0.02433; E2124G (−): 0.5365 ± 0.03641; E2124G (+): 0.5768 ± 0.03634] and PKA-Cα [control (−): 0.9823 ± 0.1819; control (+): 0.9259 ± 0.1102; WT (−): 1.256 ± 0.1595; WT (+): 1.173 ± 0.2164; S1653R (−): 1.121 ± 0.2033; S1653R (+): 1.251 ± 0.2746; E2124G (−): 1.229 ± 0.2860; E2124G (+): 1.291 ± 0.3183]. C: representative immunoblots of PDE4D3 and PP2A-C with their GAPDH and respective quantification bar graphs of four independent experiments: PDE4D3 [control (−): 1.084 ± 0.1215; control (+): 1.034 ± 0.1739; WT (−): 1.343 ± 0.2465; WT (+): 1.406 ± 0.1837; S1653R (−): 1.231 ± 0.08577; S1653R (+): 1.536 ± 0.1102; E2124G (−): 1.337 ± 0.06269; E2124G (+): 1.505 ± 0.07232] and PP2A-C [control (−): 1.008 ± 0.1251; control (+): 1.169 ± 0.09173; WT (−): 1.301 ± 0.05079; WT (+): 1.260 ± 0.04579; S1653R (−): 1.383 ± 0.1051; S1653R (+): 1.291 ± 0.1351; E2124G (−): 1.359 ± 0.1253; E2124G (+): 1.396 ± 0.07268]. In B and C, cells were pretreated with isoproterenol (ISO; 1 µM) for 10 min (+), and unstimulated cells were treated with DMSO for 10 min (−).
Fig. 6.
Fig. 6.
Expression of S1653R and E2124G single-nucleotide polymorphisms upregulate phosphorylation of endogenous cAMP response element-binding protein (CREB), PKD1, and histone deacetylase 4 (HDAC4) in human embryonic kidney (HEK)-293T cells after cell stimulation. A: representative images of immunoblots developed from PKA/phosphorylation-specific Ser133 phospho-CREB and total CREB antibodies. Quantification of the same was performed using four independent cell lysates for each group. *P < 0.05; **P < 0.01 [control (−): 1.736 ± 0.1304; control (+): 1.713 ± 0.09135; wild-type (WT) (−): 1.854 ± 0.1275; WT (+): 1.911 ± 0.1882; S1653R (−): 1.176 ± 0.1692; S1653R (+): 2.054 ± 0.1528; E2124G (−): 1.167 ± 0.07977; E2124G (+): 1.923 ± 0.1733]. B: representative immunoblots were obtained from bands developed by phospho-PKD1 (Ser916) and PKD1 antibodies. Quantification bar graphs were plotted by analyzing four separate cell lysates for each group. *P < 0.05 vs. S1653R-expressing cells before stimulation [control (−): 1.321 ± 0.05268; control (+): 1.275 ± 0.1021; WT (−): 1.268 ± 0.1290; WT (+): 1.333 ± 0.1224; S1653R (−): 0.8973 ± 0.1134; S1653R (+): 1.386 ± 0.07693; E2124G (−): 1.248 ± 0.1217; E2124G (+): 1.356 ± 0.07624]. C: representative Western blots obtained from phospho-HDAC4 (Ser467/632) and HDAC4 antibodies. Quantification bar graph plotted using four independent cell lysates for each group. Values are means ± SE. *P < 0.05 vs. S1653R-expressing cells before stimulation [control (−): 1.254 ± 0.1181; control (+): 1.390 ± 0.08392; WT (−): 1.315 ± 0.1405; WT (+): 1.400 ± 0.1390; S1653R (−): 0.9449 ± 0.1273; S1653R (+): 1.522 ± 0.1038; E2124G (−): 1.408 ± 0.1236; E2124G (+): 1.275 ± 0.09248]. In all above experiments, HEK-293T cells were pretreated with isoproterenol (ISO; 1 µM) for 10 min (+), and unstimulated cells were treated with DMSO for 10 min (−). Please note that the sequence of AC was reversed to that of the sequence of quantification graphs. This was done to avoid cutting and rearranging of bands unnecessarily, because during the experimental transfer procedure the gels were inadvertently transferred the opposite way round. IB, immunoblot analysis; IP, immunoprecipitation.
Fig. 7.
Fig. 7.
There was no change in the expression of calcineurin and phospho-MEF2D before or after isoproterenol (ISO) in mutant muscle-specific A-kinase anchoring protein-expressing human embryonic kidney-293T cells. A: representative immunoblots of bands obtained from calcineurin and GAPDH antibodies and the corresponding quantification bar graph. Values are means ± SE obtained from four independent experiments [control (−): 0.9312 ± 0.04733; control (+): 0.9992 ± 0.04312; wild-type (WT) (−): 1.019 ± 0.005362; WT (+): 1.032 ± 0.01538; S1653R (−): 1.018 ± 0.06504; S1653R (+): 1.185 ± 0.08820; E2124G (−): 1.064 ± 0.01953; E2124G (+): 1.054 ± 0.05452]. B: representative Western blot image of phospho-MEF2D (Ser444) and total MEF2D with respective bar graph quantification. Four separate experiments were performed for analysis. Values are expressed as means ± SE [control (−): 1.009 ± 0.02920; control (+): 1.065 ± 0.08603; WT (−): 0.9977 ± 0.04492; WT (+): 1.010 ± 0.06008; S1653R (−): 1.065 ± 0.06702; S1653R (+): 1.116 ± 0.06349; E2124G (−): 1.064 ± 0.06982; E2124G (+): 1.078 ± 0.08712]. −, No stimulation or absence of stimulation; +ISO stimulation, where indicated. IB, immunoblot analysis.
Fig. 8.
Fig. 8.
Summary of the role of muscle-specific A-kinase anchoring protein (mAKAP) polymorphisms in the cAMP/PKA signaling pathway. A: the S1653R single-nucleotide polymorphism, named here as a mAKAP-phosphodiesterase (PDE) mutant, showed lower cAMP levels coupled with higher PDE4D3 binding at baseline. These changes might be the possible reasons for lower PKA activity. When stimulated, along with lower PDE4D3 binding, cAMP levels and PKA activity were found to be abruptly higher. B: E2124G, named here as a mAKAP-PKA mutant, showed lower PKA binding at baseline with no changes in cAMP levels and PKA activity. After stimulation, coupled with significantly higher PKA binding and abrupt cAMP increase, PKA activity was found to be significantly higher. PP2A, protein phosphatase 2A.

Comment in

Similar articles

Cited by

References

    1. Adzhubei I, Jordan DM, Sunyaev SR. Predicting functional effect of human missense mutations using PolyPhen-2. Curr Protoc Hum Genet Chapter 7: Unit7.20, 2013. doi: 10.1002/0471142905.hg0720s76. - DOI - PMC - PubMed
    1. Adzhubei IA, Schmidt S, Peshkin L, Ramensky VE, Gerasimova A, Bork P, Kondrashov AS, Sunyaev SR. A method and server for predicting damaging missense mutations. Nat Methods 7: 248–249, 2010. doi: 10.1038/nmeth0410-248. - DOI - PMC - PubMed
    1. Bidulescu A, Liu J, Musani SK, Fox ER, Samdarshi TE, Sarpong DF, Vaccarino V, Wilson PW, Arnett DK, Din-Dzietham R, Taylor HA, Gibbons GH. Association of adiponectin with left ventricular mass in blacks: the Jackson Heart Study. Circ Heart Fail 4: 747–753, 2011. doi: 10.1161/CIRCHEARTFAILURE.110.959742. - DOI - PMC - PubMed
    1. Cambien F, Tiret L. Genetics of cardiovascular diseases: from single mutations to the whole genome. Circulation 116: 1714–1724, 2007. doi: 10.1161/CIRCULATIONAHA.106.661751. - DOI - PubMed
    1. Cooper GM, Stone EA, Asimenos G; NISC Comparative Sequencing Program, Green ED, Batzoglou S, Sidow A. Distribution and intensity of constraint in mammalian genomic sequence. Genome Res 15: 901–913, 2005. doi: 10.1101/gr.3577405. - DOI - PMC - PubMed

Publication types

MeSH terms

Substances

LinkOut - more resources