

Widespread domain-like perturbations of DNA methylation in whole blood of Down syndrome neonates
- PMID: 29601581
- PMCID: PMC5877863
- DOI: 10.1371/journal.pone.0194938
Widespread domain-like perturbations of DNA methylation in whole blood of Down syndrome neonates
Abstract
Introduction: Down syndrome (DS) is the most frequent genetic cause of intellectual disability. Despite the fact that more than 50 years have passed since the discovery of its genetic aberrations, the exact pathogenesis of the DS phenotype has remained largely unexplained. It was recently hypothesized that the DS pathogenesis involves complex (epi)genetic, molecular and cellular determinants. To date, many reports have addressed epigenetic aberrations associated with DS at different developmental stages/ages and tissue types, but to our best knowledge not in DS newborns. This study aimed to investigate genome-wide methylation patterns in DS newborns compared to non-trisomic newborns.
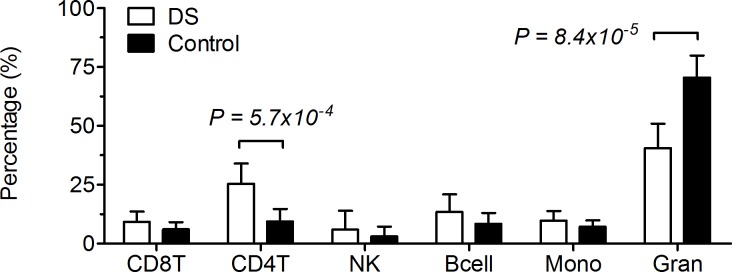
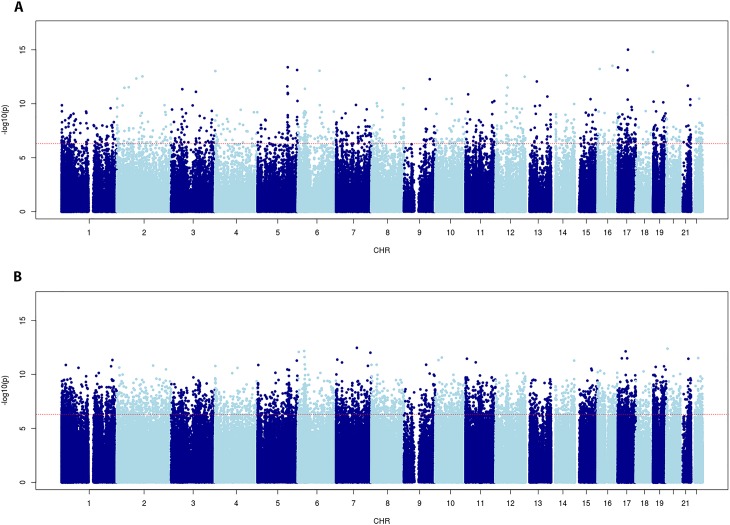
Method: We analyzed blood samples obtained from ten newborns with DS and five age-matched non-trisomic newborns. Epigenetic profiles were obtained from extracted DNA using the Illumina Infinium 450K array. Since aberrant blood cell distribution is known to be present in DS, we applied two distinct models: with and without correction for estimated blood cell distribution.
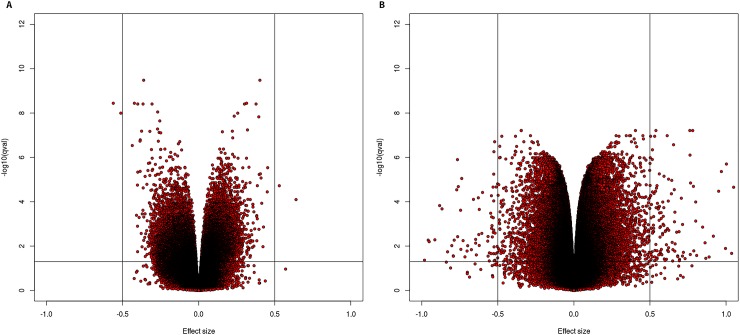
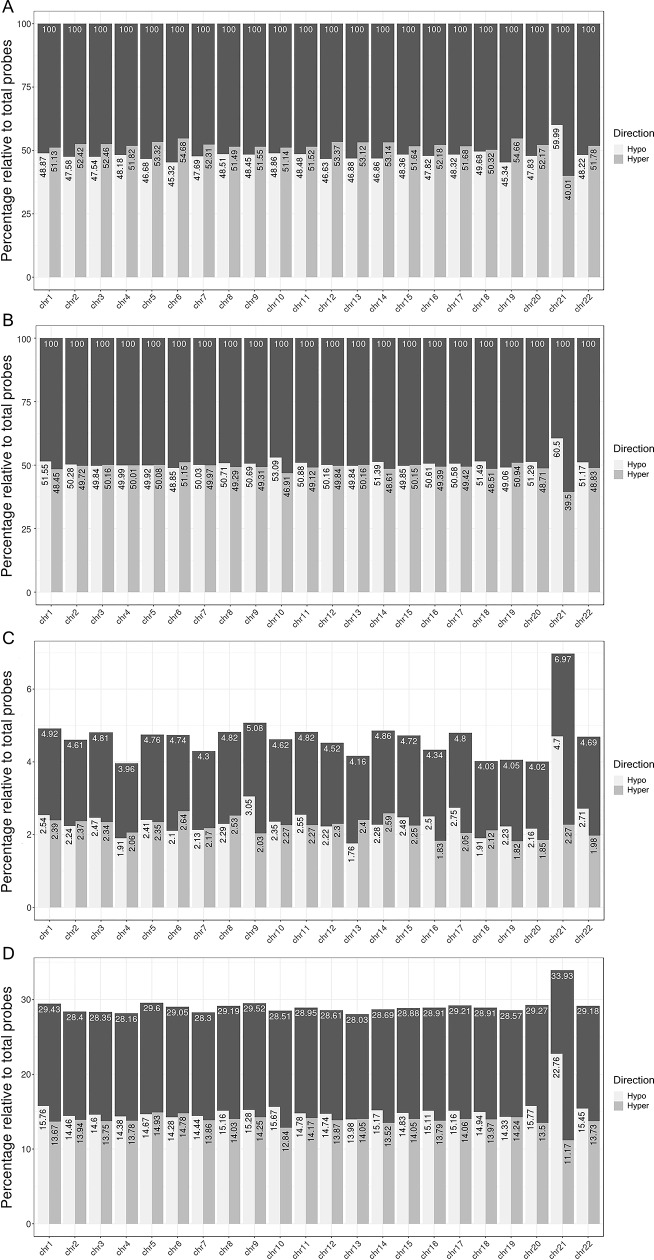
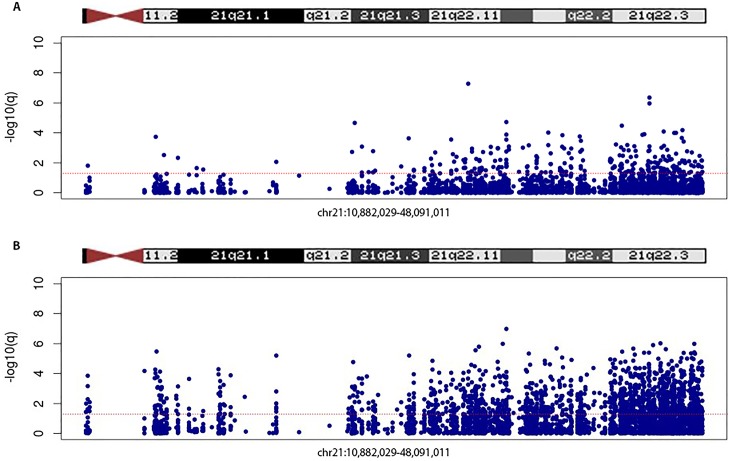
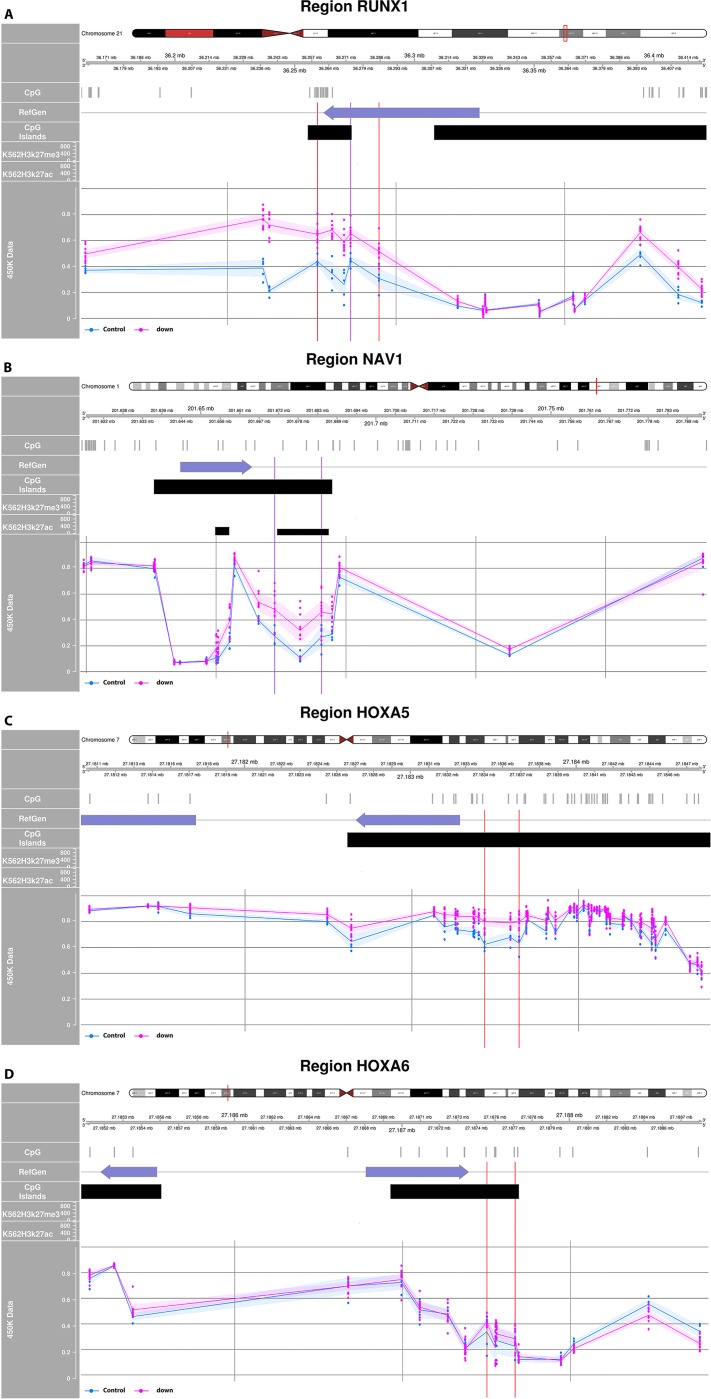
Results: Differentially methylated position (DMP) analysis of the uncorrected model detected 19525 significant hits (51,2% hypomethylated). In the corrected model, we found 121953 significant DMPs (49,8% hypomethylated). Independent of the used model we observed a chromosome 21 dosage effect. Moreover, we detected 46 and 145 differentially methylated regions in the uncorrected and corrected model respectively, both showing hypomethylation overrepresentation. Replication analyses of DMPs and DMRs found by Bacalini et al. (2015) showed a large overlap.
Conclusion: In this study, we found methylation profile differences between DS newborns and controls reflecting a systematically affected epigenetic profile. The observed chromosome 21 dosage effect suggests the involvement of affected essential regulatory factors/regions or altered expression of chromatin modeling enzymes located on chromosome 21. Additional research is necessary to substantiate these hypotheses.
Conflict of interest statement
Figures
Similar articles
-
Epigenomic signature of major congenital heart defects in newborns with Down syndrome.Hum Genomics. 2023 Oct 6;17(1):92. doi: 10.1186/s40246-023-00540-1. Hum Genomics. 2023. PMID: 37803336 Free PMC article.
-
Meta-Analysis of DNA Methylation Datasets Shows Aberrant DNA Methylation of Thyroid Development or Function Genes in Down Syndrome.Thyroid. 2023 Jan;33(1):53-62. doi: 10.1089/thy.2022.0320. Epub 2022 Dec 20. Thyroid. 2023. PMID: 36326208
-
Whole genome bisulfite sequencing of Down syndrome brain reveals regional DNA hypermethylation and novel disorder insights.Epigenetics. 2019 Jul;14(7):672-684. doi: 10.1080/15592294.2019.1609867. Epub 2019 May 6. Epigenetics. 2019. PMID: 31010359 Free PMC article.
-
Trans-acting epigenetic effects of chromosomal aneuploidies: lessons from Down syndrome and mouse models.Epigenomics. 2017 Feb;9(2):189-207. doi: 10.2217/epi-2016-0138. Epub 2016 Dec 2. Epigenomics. 2017. PMID: 27911079 Free PMC article. Review.
-
Developmental instability of the cerebellum and its relevance to Down syndrome.J Neural Transm Suppl. 2001;(61):11-34. doi: 10.1007/978-3-7091-6262-0_2. J Neural Transm Suppl. 2001. PMID: 11771737 Review.
Cited by
-
Associations between birth defects and childhood and adolescent germ cell tumors according to sex, histologic subtype, and site.Cancer. 2023 Oct 15;129(20):3300-3308. doi: 10.1002/cncr.34906. Epub 2023 Jun 27. Cancer. 2023. PMID: 37366624 Free PMC article.
-
DNA methylation changes in Down syndrome derived neural iPSCs uncover co-dysregulation of ZNF and HOX3 families of transcription factors.Clin Epigenetics. 2020 Jan 8;12(1):9. doi: 10.1186/s13148-019-0803-1. Clin Epigenetics. 2020. PMID: 31915063 Free PMC article.
-
Birthweight DNA methylation signatures in infant saliva.Clin Epigenetics. 2021 Mar 19;13(1):57. doi: 10.1186/s13148-021-01053-1. Clin Epigenetics. 2021. PMID: 33741061 Free PMC article.
-
Methylomic profiling in trisomy 21 identifies cognition- and Alzheimer's disease-related dysregulation.Clin Epigenetics. 2019 Dec 16;11(1):195. doi: 10.1186/s13148-019-0787-x. Clin Epigenetics. 2019. PMID: 31843015 Free PMC article.
-
Increased risk of leukaemia in children with Down syndrome: a somatic evolutionary view.Expert Rev Mol Med. 2021 Apr 27;23:e5. doi: 10.1017/erm.2021.6. Expert Rev Mol Med. 2021. PMID: 33902785 Free PMC article.
References
-
- Antonarakis SE, Lyle R, Dermitzakis ET, Reymond A, Deutsch S. Chromosome 21 and down syndrome: from genomics to pathophysiology. Nat Rev Genet. 2004;5(10):725–38. doi: 10.1038/nrg1448 . - DOI - PubMed
-
- Newton RW PSaML. Advances in Molecular Genetics Down Syndrome: Current Perspectives: Mac Keith Press; 2015. p. 3–12.
-
- Lejeune J, Gautier M, Turpin R. [Study of somatic chromosomes from 9 mongoloid children]. C R Hebd Seances Acad Sci. 1959;248(11):1721–2. . - PubMed
-
- Patterson D. Genetic mechanisms involved in the phenotype of Down syndrome. Ment Retard Dev Disabil Res Rev. 2007;13(3):199–206. doi: 10.1002/mrdd.20162 . - DOI - PubMed
MeSH terms
LinkOut - more resources
Full Text Sources
Other Literature Sources
Medical
Molecular Biology Databases
