. 2018 Aug;39(8):3127-3142.
doi: 10.1002/hbm.24064. Epub 2018 Mar 30.

Connectivity dynamics in typical development and its relationship to autistic traits and autism spectrum disorder

Affiliations

Connectivity dynamics in typical development and its relationship to autistic traits and autism spectrum disorder

Barnaly Rashid et al. Hum Brain Mapp. 2018 Aug.

Abstract

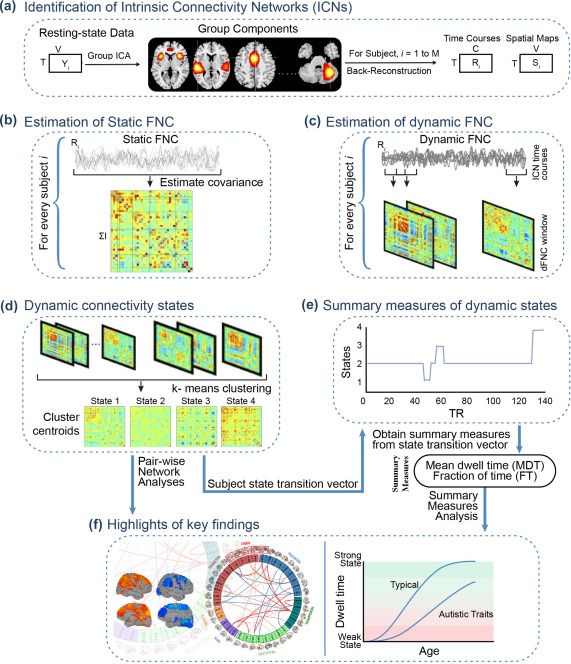
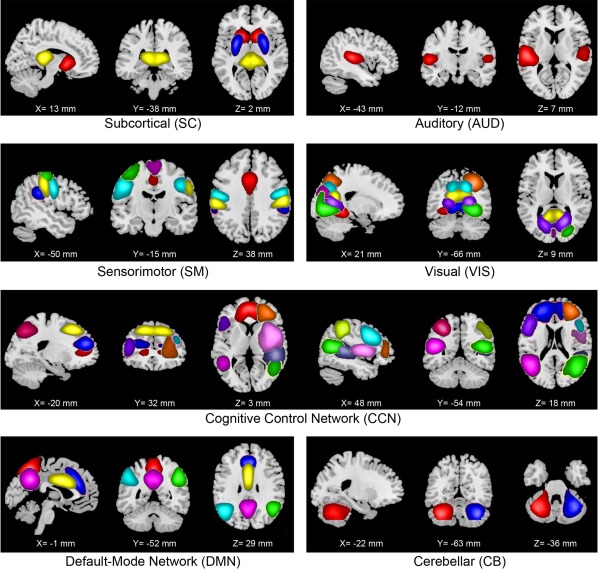
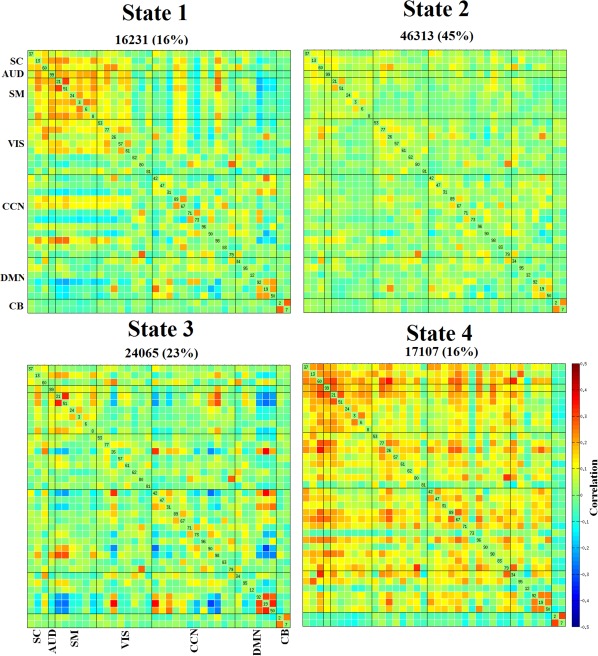
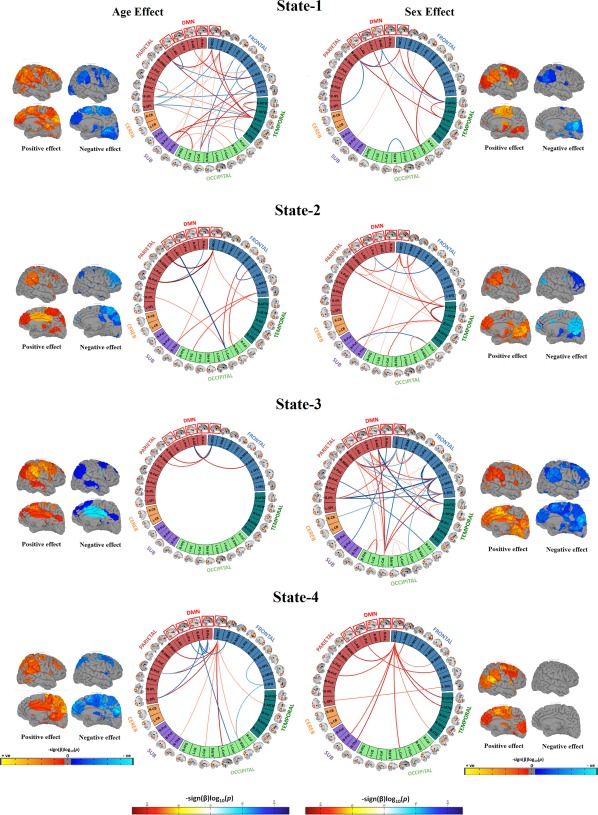
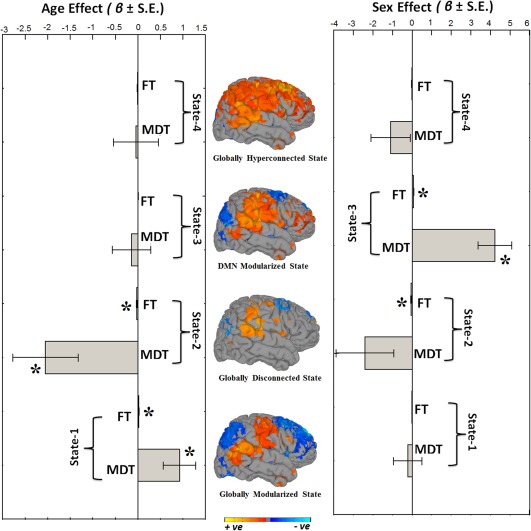
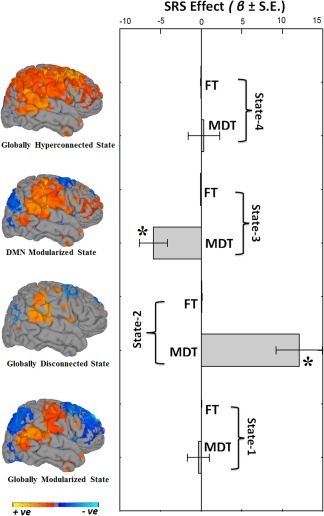
Recent advances in neuroimaging techniques have provided significant insights into developmental trajectories of human brain function. Characterizations of typical neurodevelopment provide a framework for understanding altered neurodevelopment, including differences in brain function related to developmental disorders and psychopathology. Historically, most functional connectivity studies of typical and atypical development operate under the assumption that connectivity remains static over time. We hypothesized that relaxing stationarity assumptions would reveal novel features of both typical brain development related to children on the autism spectrum. We employed a "chronnectomic" (recurring, time-varying patterns of connectivity) approach to evaluate transient states of connectivity using resting-state functional MRI in a population-based sample of 774 6- to 10-year-old children. Dynamic connectivity was evaluated using a sliding-window approach, and revealed four transient states. Internetwork connectivity increased with age in modularized dynamic states, illustrating an important pattern of connectivity in the developing brain. Furthermore, we demonstrated that higher levels of autistic traits and ASD diagnosis were associated with longer dwell times in a globally disconnected state. These results provide a roadmap to the chronnectomic organization of the developing brain and suggest that characteristics of functional brain connectivity are related to children on the autism spectrum.

Keywords: autism spectrum disorder; functional connectivity dynamics; independent component analysis; resting-state fMRI; typical development.


Conflict of interest statement

The authors declare no competing financial interests in relation to the work presented.

Figures

Figure 1
Figure 1
Graphical depiction of the analysis method and key findings. (a) The static and dynamic functional network connectivity (FNC) approach begins with group‐independent component analysis (ICA) to decompose resting‐state fMRI data into intrinsic connectivity networks (ICNs). The group ICA approach provides a measure of the component time courses and spatial maps for each subject using the back‐reconstruction technique. (b) Static FNC between components is estimated as the covariance of the time courses. (c) Dynamic FNC is estimated as the covariance from windowed portions of the time courses. (d) K‐means clustering is used to identify discrete dynamic connectivity states. (e) Results obtained from k‐means clustering are used to determine which state a given subject is occupying at a given time, and summary measures of dynamic states, such as, mean dwell time (MDT) and fraction of time (FT) spent in each state over the duration of the measurement period are computed. (f) Highlights of the key findings for pairwise network analyses and summary measures analyses in association with age, sex, and autistic traits [Color figure can be viewed at http://wileyonlinelibrary.com]
Figure 2
Figure 2
Nonartefactual intrinsic connectivity networks (ICNs). Composite maps of the 38 identified intrinsic connectivity networks (ICNs) used in static and dynamic functional network connectivity (FNC) analyses. The ICNs are divided into seven subcategories and arranged based on their anatomical and functional properties. Within each functional network, each color in the composite maps corresponds to a different ICN. Component labels and peak coordinates are provided in Supporting Information, Table S8 [Color figure can be viewed at http://wileyonlinelibrary.com]
Figure 3
Figure 3
Dynamic functional network connectivity (FNC) states. The four dynamic states represented in connectivity matrices are symmetrically grouped by functional networks, and colors represent the average strength and direction of the pairwise correlation between two components, with red–yellow indicating a positive correlation, and blue indicating a negative correlation. Here, SC = subcortical; AUD = auditory; SM = sensorimotor; VIS = visual; CCN = cognitive control network; DMN = default‐mode network; CB = cerebellar network. Labels for the dynamic states include state‐1: globally modularized; state‐2: globally disconnected; state‐3: DMN modularized; and state‐4: globally hyperconnected [Color figure can be viewed at http://wileyonlinelibrary.com]
Figure 4
Figure 4
Connectogram and rendering maps showing age and sex associations across the dynamic connectivity states. Connectograms are sorted by major brain lobes. Rendering maps are divided into average positive and negative effects. For age analyses, red lines indicate positive association between a particular pairwise connection and age, whereas blue lines indicate a negative age association. For analyses of sex, red lines indicate where female subjects showed stronger connectivity than male subjects, and blue lines indicate where male subjects showed stronger connectivity compared to female subjects. All the results presented in the connectograms survived the false discovery rate (FDR) multiple comparison correction threshold of p FDR = .05 [Color figure can be viewed at http://wileyonlinelibrary.com]
Figure 5
Figure 5
Summary metrics and age‐ and sex‐ effects. Summary metrics from the four dynamic connectivity states in relation to age and sex. Mean dwell time (MDT) represents how long an individual spends in a given state on average, and fraction of time (FT) is the summed total time spent in a given state over the course of the measurement period. For age associations, positive beta coefficient (β) indicates older children spend more time in that particular state whereas negative beta coefficient (β) indicates younger children spend more time in a particular state. For sex analyses, positive beta coefficient (β) indicates girls spend more time in the state relative to boys and negative beta coefficient (β) indicates that boys spend more time in the state relative to girls. Bar graphs indicate the unstandardized beta coefficients (β) with standard error (S.E.) from regression models, and asterisks (*) indicate the results survived the false discovery rate (FDR) multiple comparison correction threshold of p FDR = .05. The rendering brain maps are showing modularized positive (red) and negative (blue) connectivity for the corresponding dynamic states [Color figure can be viewed at http://wileyonlinelibrary.com]
Figure 6
Figure 6
Summary metrics and autistic trait effects. Summary metrics from the four dynamic connectivity states in relation to autistic traits. Mean dwell time (MDT) represents how long an individual spends in a given state on average, and fraction of time (FT) is the summed total time spent in a given state over the course of the measurement period. Positive beta coefficient (β) indicates that higher levels of autistic traits are associated with more time spent in a particular state, whereas negative beta coefficient (β) indicates lower levels of autistic traits are associated with more time spent in a particular state. Bar graphs indicate the unstandardized beta coefficients (β) with standard error (S.E.) from regression models, and asterisks (*) indicate the results survived the false discovery rate (FDR) multiple comparison correction threshold of p FDR = .05. The rendering brain maps are showing modularized positive (red) and negative (blue) connectivity for the corresponding dynamic states [Color figure can be viewed at http://wileyonlinelibrary.com]

Comment in

Similar articles

Cited by

References

    1. Agcaoglu, O. , Miller, R. , Damaraju, E. , Rashid, B. , Bustillo, J. , Cetin, M. , … Ford, J. (2017). Decreased hemispheric connectivity and decreased intra‐and inter‐hemisphere asymmetry of resting state functional network connectivity in schizophrenia. Brain Imaging and Behavior, 1–16. - PMC - PubMed
    1. Allen, E. A. , Damaraju, E. , Plis, S. M. , Erhardt, E. B. , Eichele, T. , & Calhoun, V. D. (2012). Tracking whole‐brain connectivity dynamics in the resting state. Cerebral Cortex. - PMC - PubMed
    1. Allen, E. A. , Damaraju, E. , Plis, S. M. , Erhardt, E. B. , Eichele, T. , & Calhoun, V. D. (2014). Tracking whole‐brain connectivity dynamics in the resting state. Cerebral Cortex, 24(3), 663–676. - PMC - PubMed
    1. Baxter, A. J. , Brugha, T. S. , Erskine, H. E. , Scheurer, R. W. , Vos, T. , & Scott, J. G. (2015). The epidemiology and global burden of autism spectrum disorders. Psychological Medicine, 45(03), 601–613. - PubMed
    1. Bell, A. J. , & Sejnowski, T. J. (1995). An information‐maximization approach to blind separation and blind deconvolution. Neural Computation, 7(6), 1129–1159. - PubMed

Publication types