. 2018 Jun;46(6):813-822.
doi: 10.1124/dmd.118.080903. Epub 2018 Mar 30.

Formation of Both Heme and Apoprotein Adducts Contributes to the Mechanism-Based Inactivation of Human CYP2J2 by 17 α-Ethynylestradiol

Affiliations

Formation of Both Heme and Apoprotein Adducts Contributes to the Mechanism-Based Inactivation of Human CYP2J2 by 17 α-Ethynylestradiol

Hsia-Lien Lin et al. Drug Metab Dispos. 2018 Jun.

Abstract

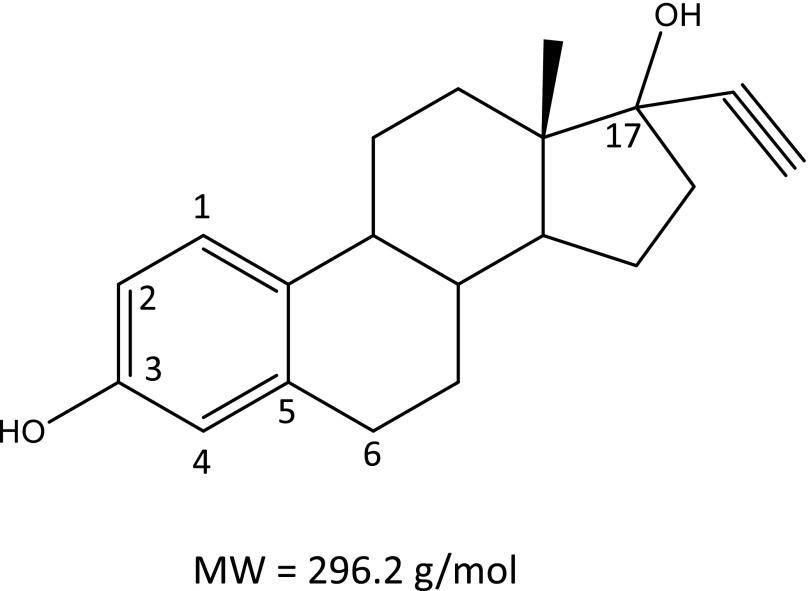
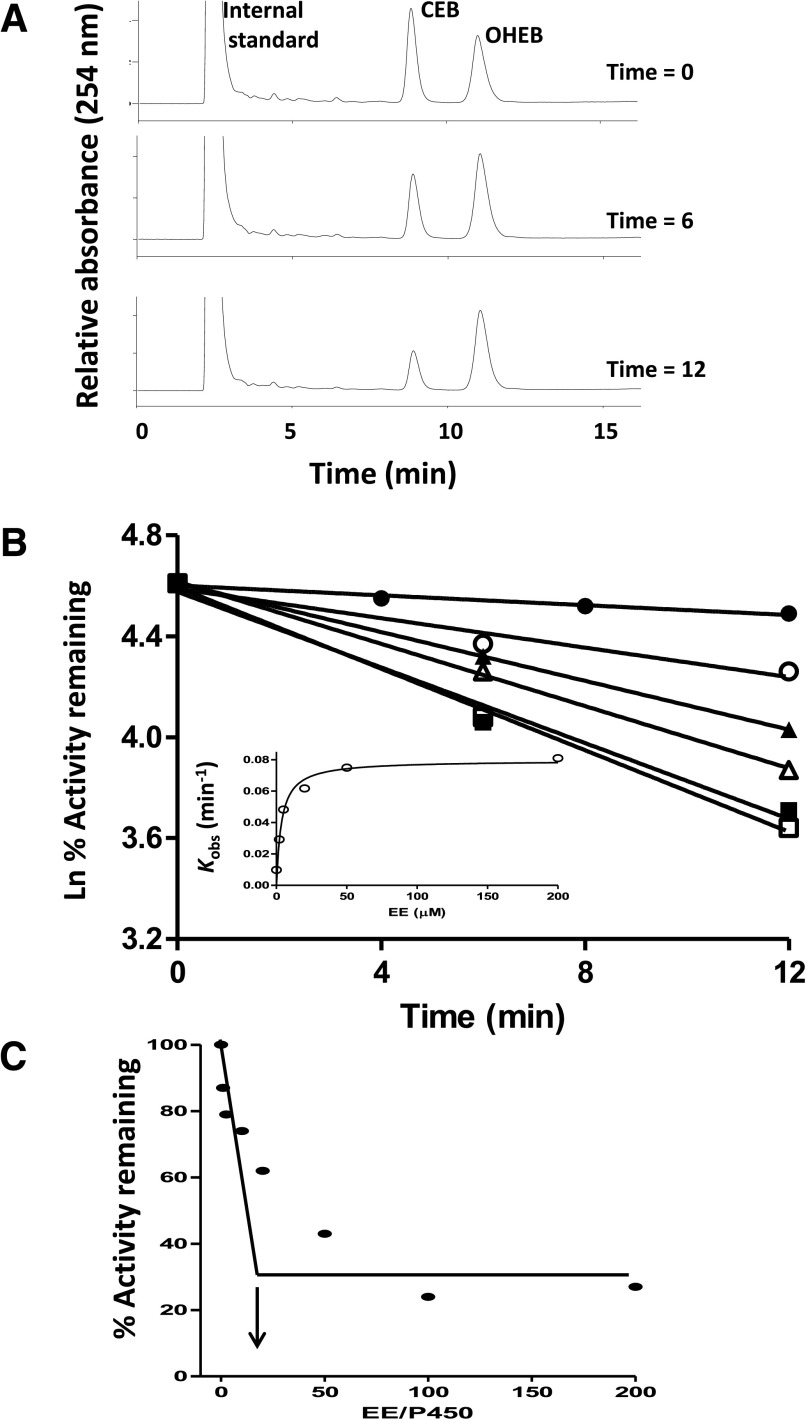
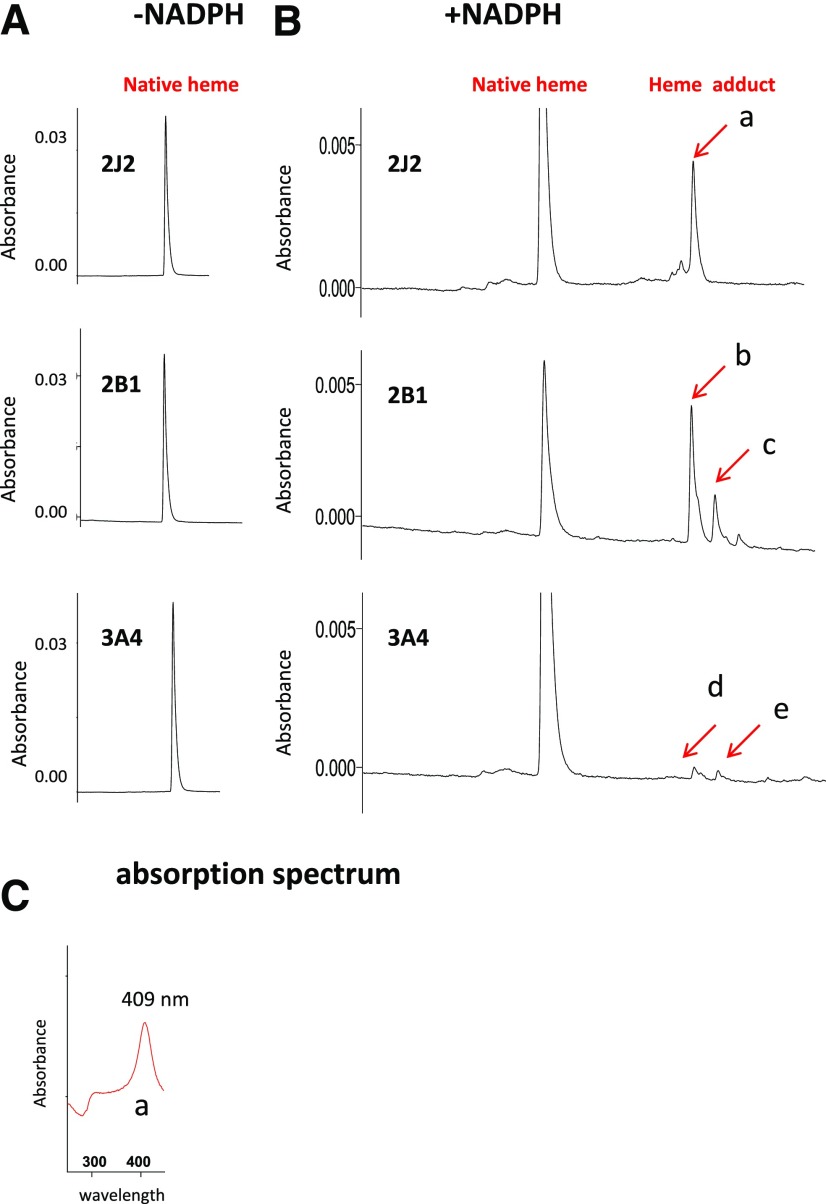
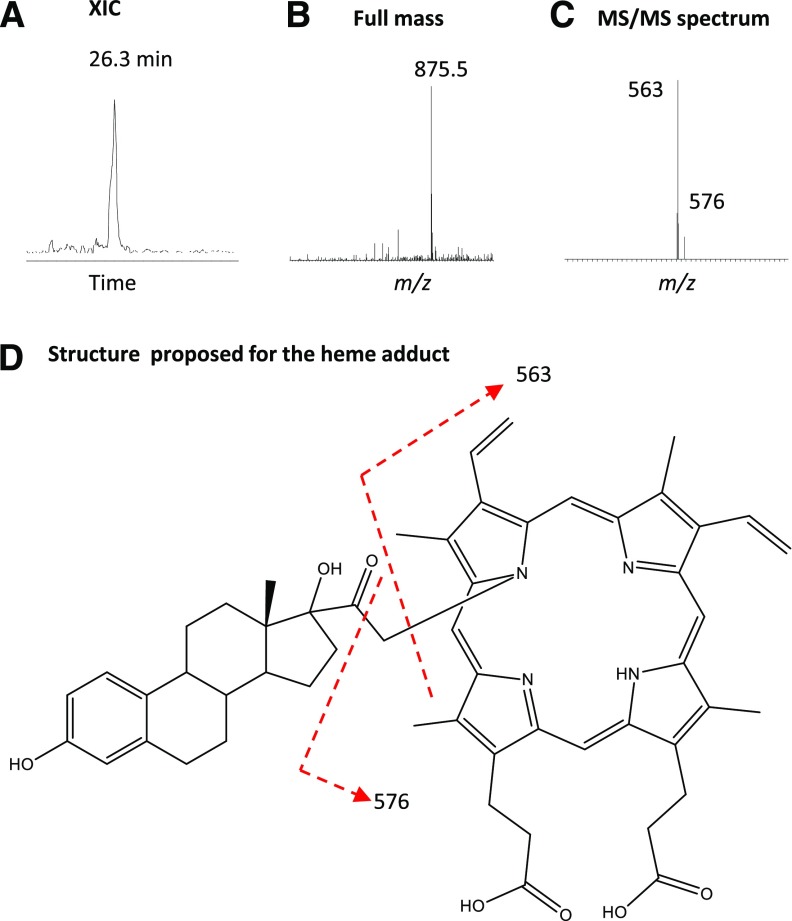
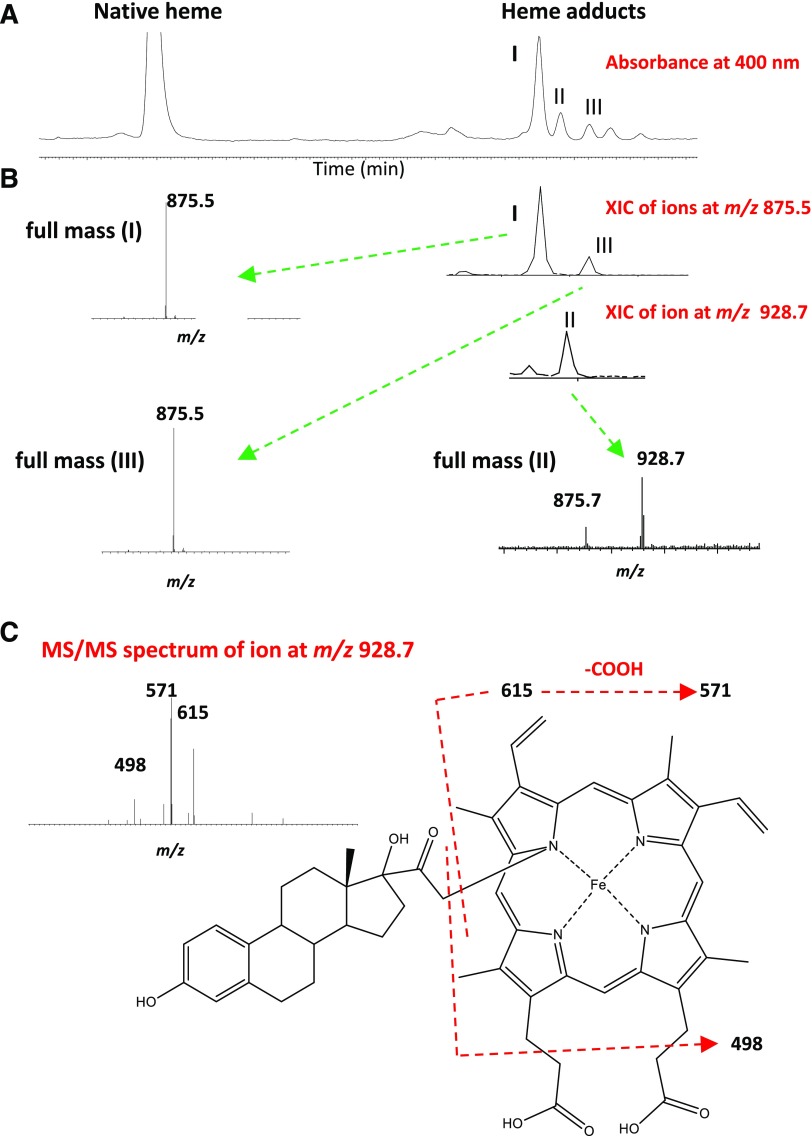
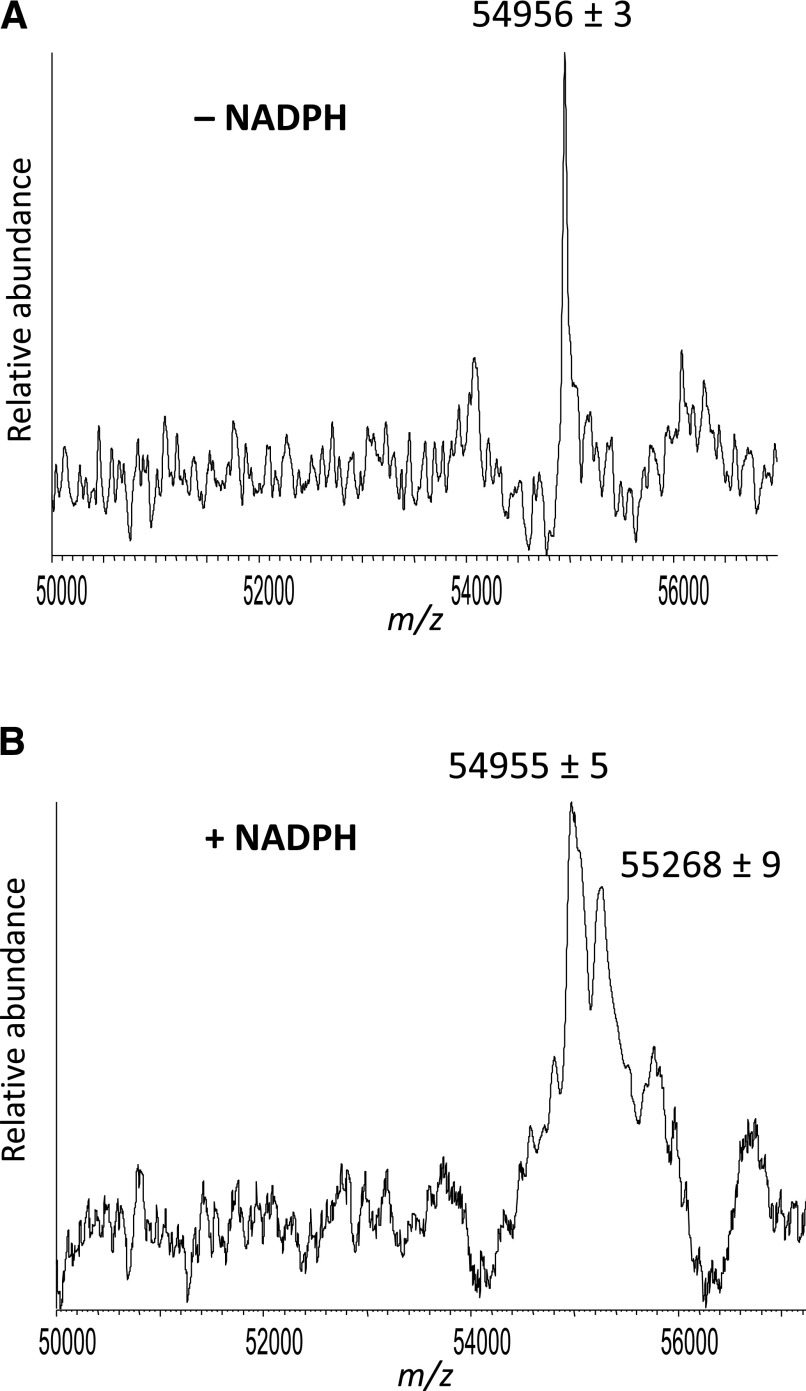
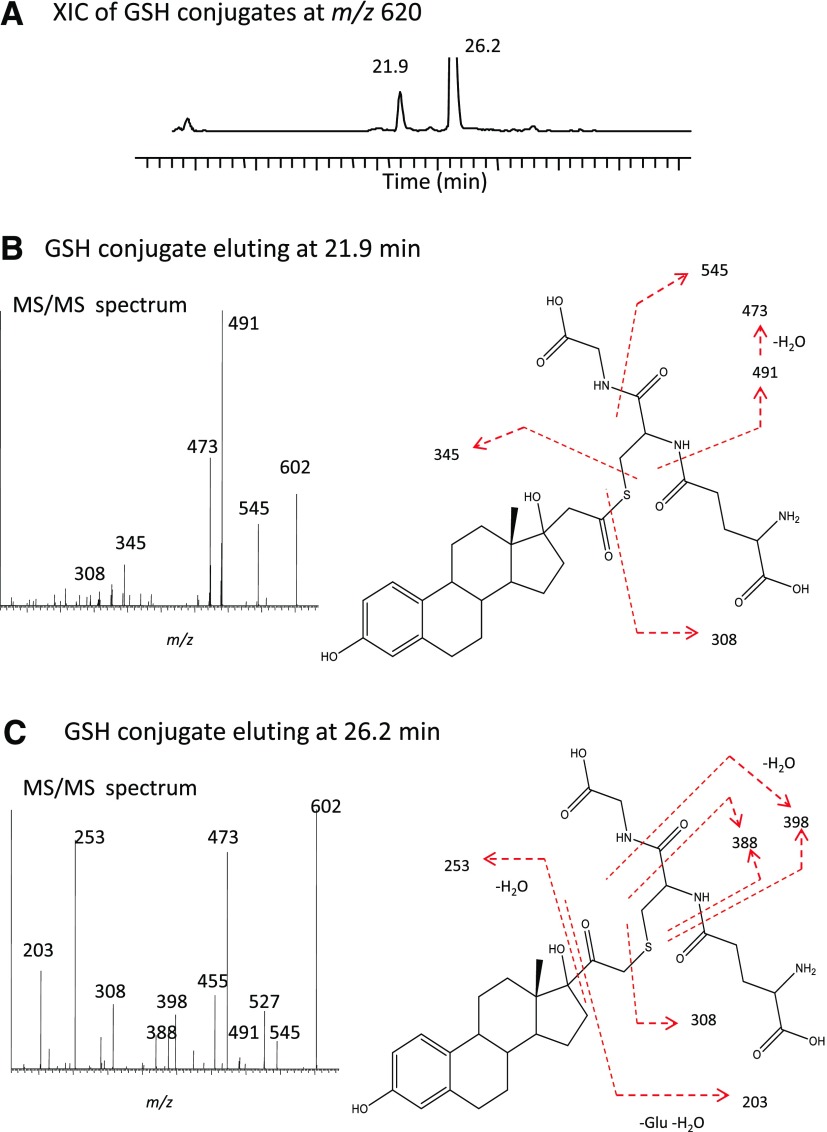
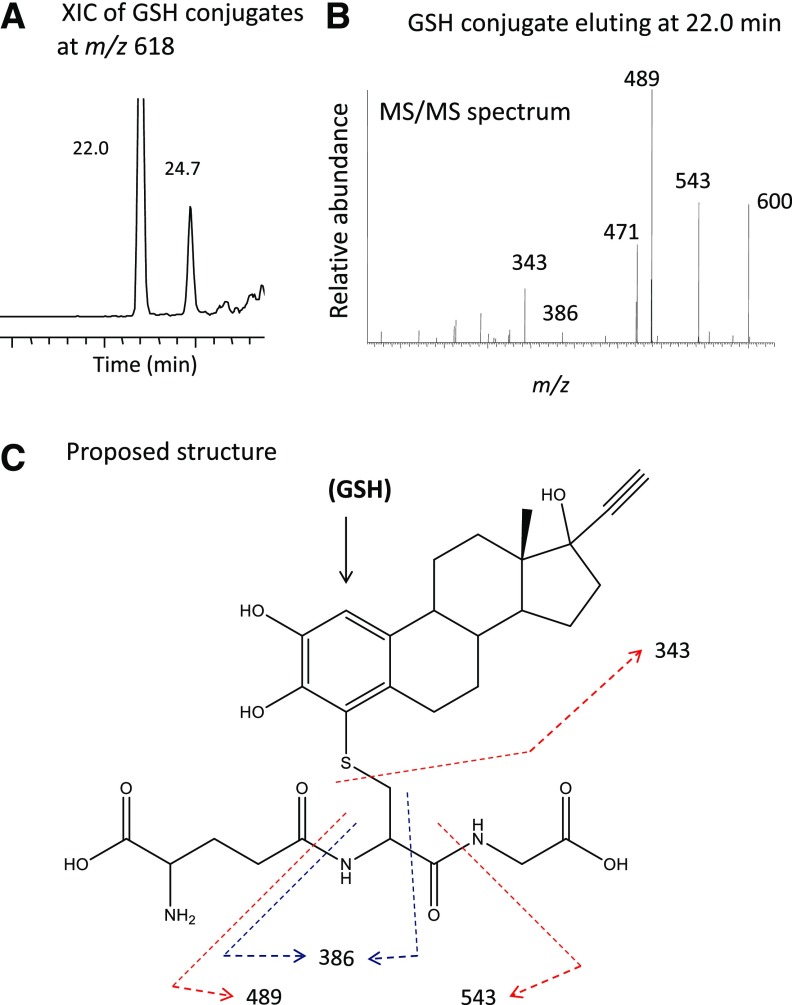
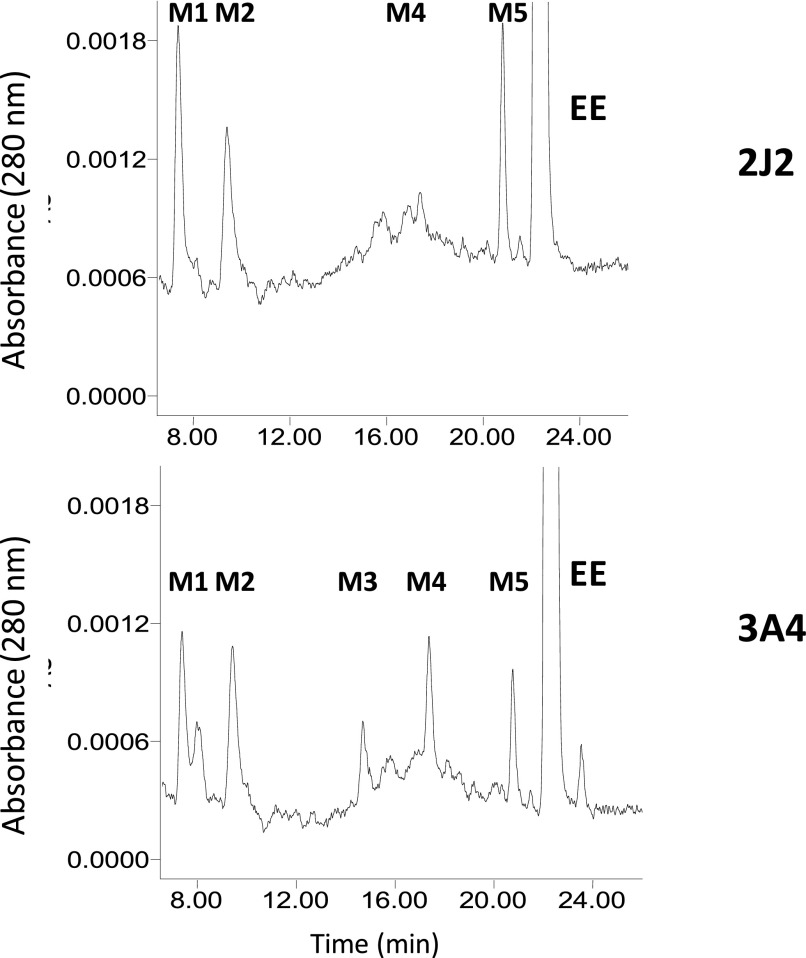
17α-Ethynylestradiol (EE), a major component of many oral contraceptives, affects the activities of a number of the human cytochrome P450 (P450) enzymes. Here, we characterized the effect of EE on CYP2J2, a major human P450 isoform that participates in metabolism of arachidonic acid. EE inactivated the hydroxyebastine carboxylation activity of CYP2J2 in a reconstituted system. The loss of activity is time and concentration dependent and requires NADPH. The KI and kinact values for the inactivation were 3.6 μM and 0.08 minute-1, respectively. Inactivation of CYP2J2 by EE was due to formation of a heme adduct as well as an apoprotein adduct. Mass spectral analysis of CYP2J2 partially inactivated by EE showed two distinct protein masses in the deconvoluted spectrum that exhibited a mass difference of approximately 312 Da, which is equivalent to the sum of the mass of EE and one oxygen atom. Liquid chromatography-tandem mass spectrometry (LC-MS/MS) analysis revealed a heme adduct with MH+ ion at m/z 875.5, corresponding to alkylation of an iron-depleted prosthetic heme by EE plus one oxygen atom. The reactive intermediate responsible for covalently modifying both the prosthetic heme and apoprotein was characterized by trapping with glutathione (GSH). LC-MS/MS analysis revealed two GSH conjugate isomers with MH+ ions at m/z 620, which were formed by reaction between GSH and EE with the oxygen being added to either the internal or terminal carbon of the ethynyl moiety. High-pressure liquid chromatography analysis revealed that three other major metabolites were formed during EE metabolism by CYP2J2.


Figures

Fig. 1.
Fig. 1.
Chemical structure of EE. Some of the carbon atoms are numbered.
Fig. 2.
Fig. 2.
Calculation of the kinetic values and the partition ratio for the inactivation of CYP2J2 by EE. (A) Representative HPLC metabolite profile showing the time-dependent loss in the formation of CEB from OHEB after the reaction mixtures were incubated with 20 μM EE and 1 mM NADPH for 6 and 12 minutes. (B) The time- and concentration-dependent inactivation of CYP2J2 by EE. The reconstituted system was incubated with 0 (●), 1 (○), 5 (▴), 20 (△), 50 (▪), and 200 μM (□) EE, and aliquots were removed at the times indicated and assayed for residual OHEB metabolism activity as described in Materials and Methods. The catalytic activity at time zero was used as the 100% control to calculate the initial rate constants for the inactivation (kobs) for each concentration of EE. The inset shows the fitting of the initial rate constants to the Michaelis-Menten equation as a function of the EE concentrations. The KI and kinact values were determined to be 3.6 μM and 0.08 minute−1. (C) Determination of the partition ratio for the inactivation of CYP2J2 by EE. The percentage of catalytic activity remaining was determined as a function of the molar ratio of EE to CYP2J2 as described in Materials and Methods. The partition ratio was estimated from the intercept of the linear regression line from the lower ratios of EE to CYP2J2 and the straight line obtained from the higher ratios of EE to CYP2J2. The data represent the average of two separate experiments done in duplicate and that did not differ by >10%.
Fig. 3.
Fig. 3.
Formation of a heme adduct after incubating CYP2J2 with EE and comparison with heme adducts formed with two other major mammalian P450s under the same experimental conditions. (A) HPLC elution profiles monitored at 400 nm for prosthetic heme in the absence of NADPH. (B) HPLC elution profiles showing formation of heme adducts in the presence of NADPH. The heme adducts are labeled as “a” for CYP2J2, “b” and “c” for CYP2B1, and “d” and “e” for CYP3A4. (C) Photodiode-array spectrum of the heme adduct “a” shown for CYP2J2 in (B). The experimental procedures are described in Materials and Methods.
Fig. 4.
Fig. 4.
Fe-depleted heme adduct analyzed by LC-MS/MS following inactivation of CYP2J2 by EE. (A) The XIC of the ion at m/z 875.5. (B) The full mass spectrum for the peak having a MH+ ion at m/z 875.5. (C) MS/MS spectrum for the MH+ ion at m/z 875.5. (D) Structure proposed for the heme adduct formed by alkylation of the Fe-depleted heme by EE with the activated oxygen added to the internal carbon of the ethynyl moiety. The dashed lines indicate the sites of fragmentation. The MS/MS spectra were obtained in the positive mode and analyzed using the Xcalibur software package (Thermo Fisher Scientific).
Fig. 5.
Fig. 5.
LC-MS/MS analysis of CYP2B1 heme adducts after inactivation by incubation of the reaction mixture with EE. The reaction mixture was injected directly onto a reverse-phase HPLC column and the effluent was analyzed using a photodiode-array detector and a Thermo Fisher Scientific LTQ linear ion trap mass spectrometer. (A) HPLC elution profile for native heme and heme adducts I, II, and III monitored at 400 nm. (B) The XICs for the heme adducts observed in the HPLC elution profile and the full mass spectra of the heme adducts having the MH+ ion at m/z 875.5 or 928.7. (C) The MS/MS spectrum of the MH+ ion at m/z 928.7 and the structure proposed for the Fe-containing heme adduct formed by alkylation of the prosthetic heme by EE with the activated oxygen added to the internal carbon of ethynyl moiety. The dashed lines indicate the sites of fragmentation.
Fig. 6.
Fig. 6.
Detection of the EE-adducted CYP2J2 apoprotein by ESI-LC-MS analysis. The incubation conditions and MS analysis conditions are described in Materials and Methods. (A) Representative deconvoluted mass spectrum of CYP2J2 incubated with EE in the absence of NADPH. (B) Representative deconvoluted mass spectrum of CYP2J2 incubated with EE in the presence of NADPH.
Fig. 7.
Fig. 7.
Structural identification of the two GSH conjugates of EE with precursor ions at m/z 620 analyzed by LC-MS/MS. (A) The XICs of the GSH conjugates having the molecular ions at m/z 620 eluting at 21.9 and 26.2 minutes. (B) MS/MS spectrum of the GSH conjugate eluting at 21.9 minutes. (C) MS/MS spectrum of the GSH conjugate eluting at 26.2 minutes. The proposed structures of the GSH conjugates are displayed in the panel on the right-hand side. The dashed lines indicate the sites of fragmentation.
Fig. 8.
Fig. 8.
Structural identification of the two GSH conjugates of EE with precursor ions at m/z 618 analyzed by LC-MS/MS. (A) The XICs of the GSH conjugates having molecular ions at m/z 618 eluting at 22.0 and 24.7 minutes. (B) MS/MS spectrum of GSH conjugate eluting at 22.0 minutes. (C) The proposed structure of the GSH conjugate. The dashed lines indicate the sites of fragmentation.
Fig. 9.
Fig. 9.
HPLC separation of the major metabolites of EE formed, catalyzed by CYP2J2 and CYP3A4. Reaction mixtures containing CYP2J2 (top panel) and CYP3A4 (bottom panel) in the reconstituted system were incubated with EE and NADPH at 37°C for 30 minutes, and then were extracted with ethyl acetate and analyzed by HPLC as described in Materials and Methods.

Similar articles

Cited by

References

    1. Ahluwalia BS, Curry CL, Crocker CL, Verma PS. (1977) Evidence of higher ethynylestradiol blood levels in human hypertensive oral contraceptive users. Fertil Steril 28:627–630. - PubMed
    1. Baillie TA, Davis MR. (1993) Mass spectrometry in the analysis of glutathione conjugates. Biol Mass Spectrom 22:319–325. - PubMed
    1. Bolt HM, Bolt M, Kappus H. (1977) Interaction of rifampicin treatment with pharmacokinetics and metabolism of ethinyloestradiol in man. Acta Endocrinol (Copenh) 85:189–197. - PubMed
    1. Chan WK, Sui Z, Ortiz de Montellano PR. (1993) Determinants of protein modification versus heme alkylation: inactivation of cytochrome P450 1A1 by 1-ethynylpyrene and phenylacetylene. Chem Res Toxicol 6:38–45. - PubMed
    1. Chang SY, Chen C, Yang Z, Rodrigues AD. (2009) Further assessment of 17α-ethinyl estradiol as an inhibitor of different human cytochrome P450 forms in vitro. Drug Metab Dispos 37:1667–1675. - PubMed

Publication types

LinkOut - more resources