. 2018 Oct;18(5):407-419.
doi: 10.1007/s12012-018-9451-5.

Methylene Blue Counteracts H2S-Induced Cardiac Ion Channel Dysfunction and ATP Reduction

Affiliations

Methylene Blue Counteracts H2S-Induced Cardiac Ion Channel Dysfunction and ATP Reduction

Joseph Y Cheung et al. Cardiovasc Toxicol. 2018 Oct.

Abstract

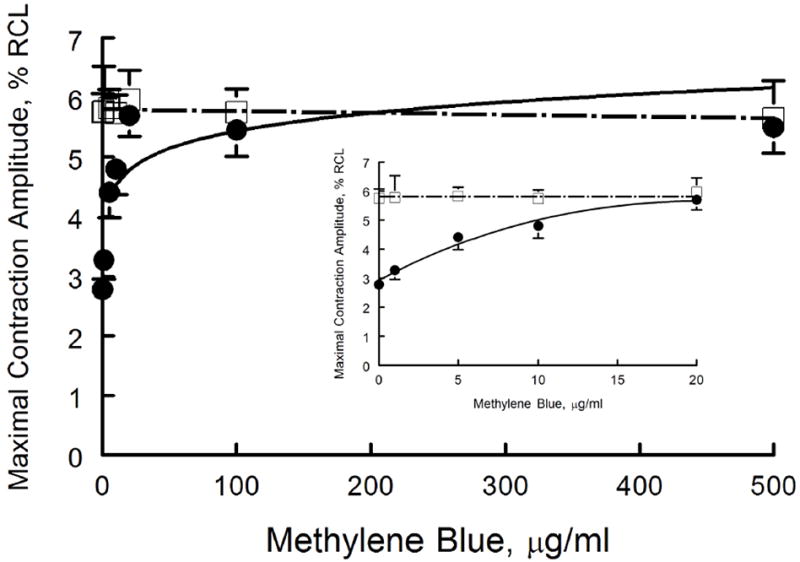
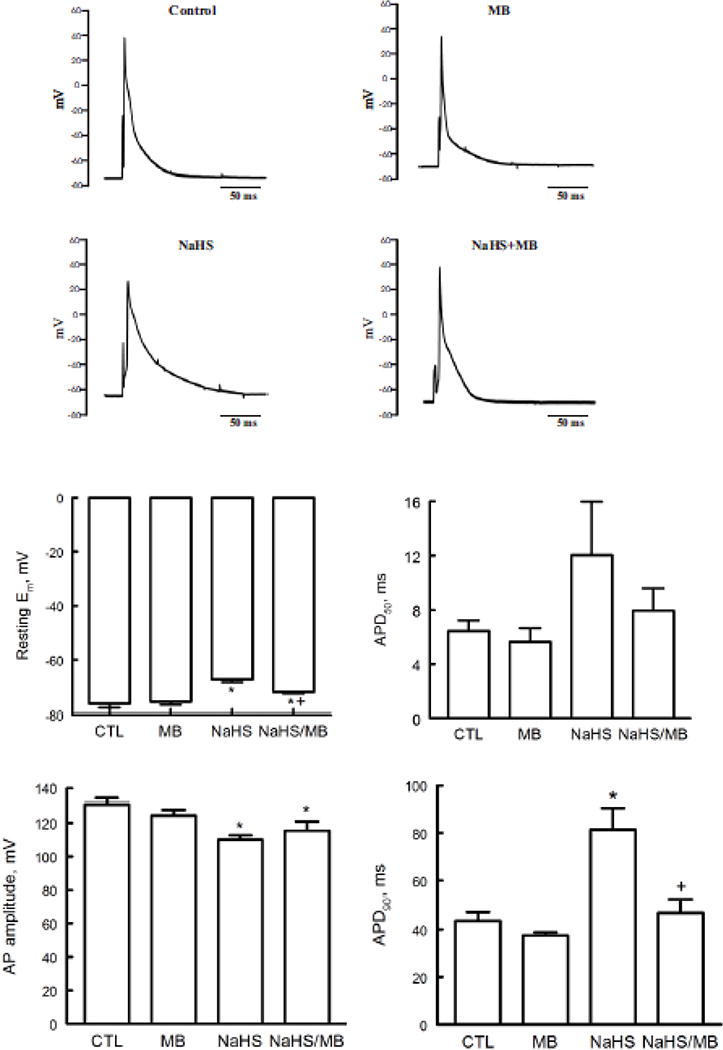
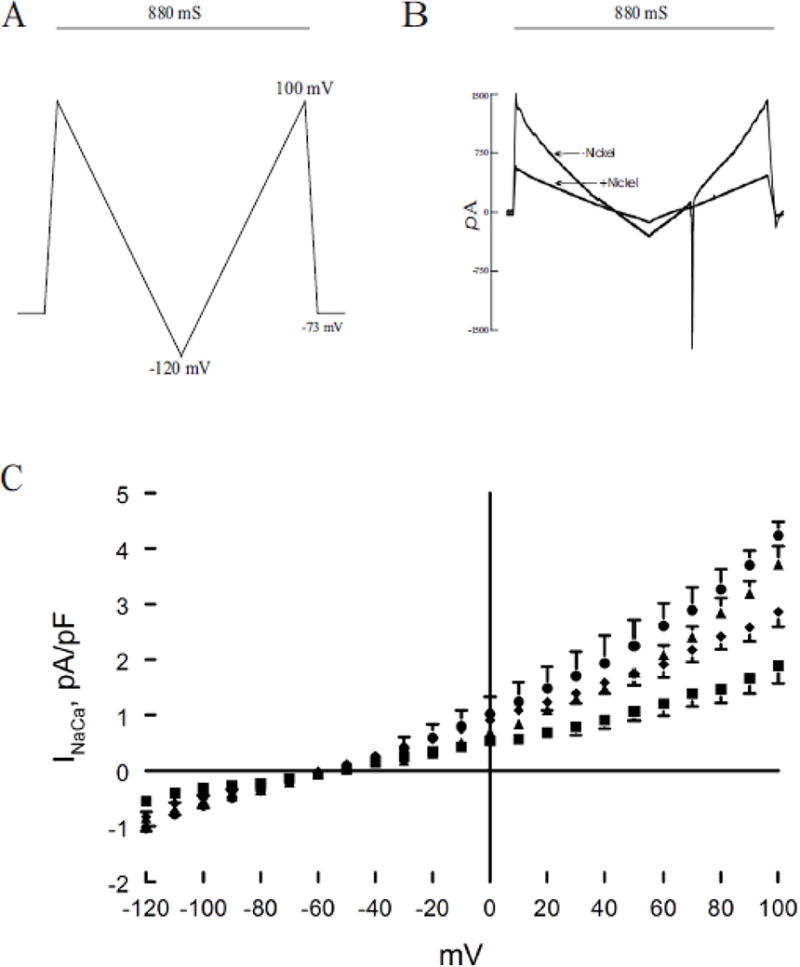
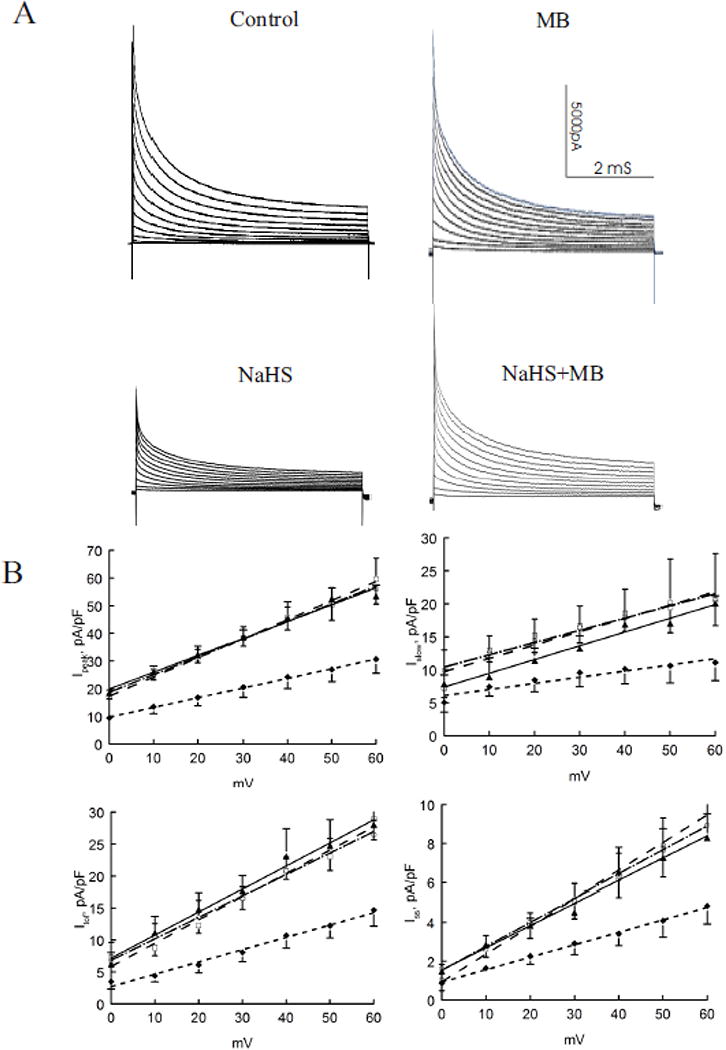
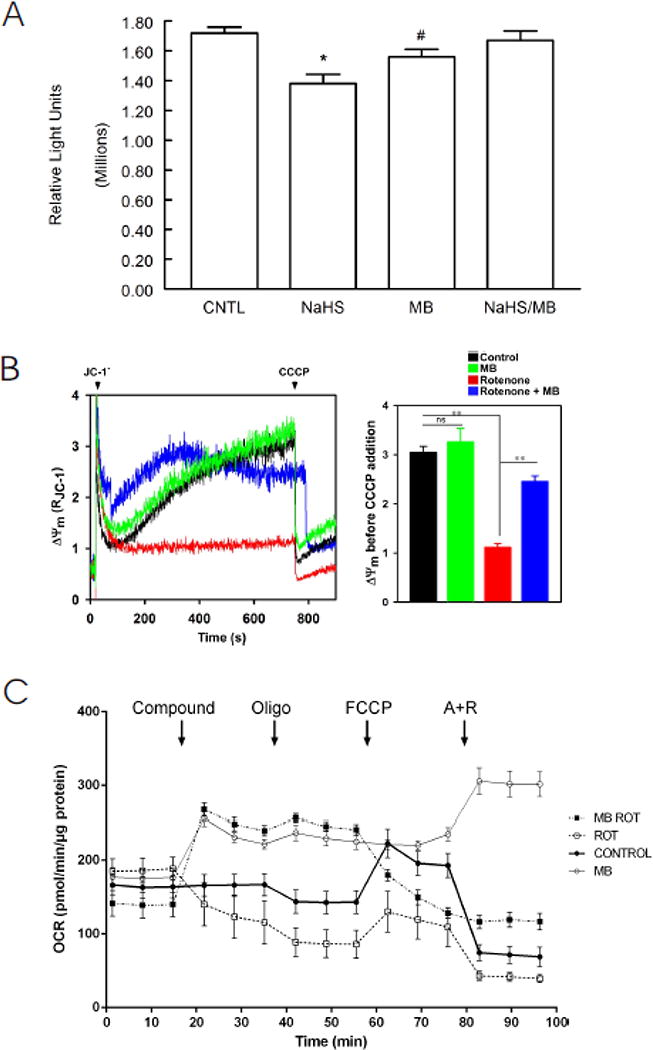
We have previously demonstrated that methylene blue (MB) counteracts the effects of hydrogen sulfide (H2S) cardiotoxicity by improving cardiomyocyte contractility and intracellular Ca2+ homeostasis disrupted by H2S poisoning. In vivo, MB restores cardiac contractility severely depressed by sulfide and protects against arrhythmias, ranging from bundle branch block to ventricular tachycardia or fibrillation. To dissect the cellular mechanisms by which MB reduces arrhythmogenesis and improves bioenergetics in myocytes intoxicated with H2S, we evaluated the effects of H2S on resting membrane potential (Em), action potential (AP), Na+/Ca2+ exchange current (INaCa), depolarization-activated K+ currents and ATP levels in adult mouse cardiac myocytes and determined whether MB could counteract the toxic effects of H2S on myocyte electrophysiology and ATP. Exposure to toxic concentrations of H2S (100 µM) significantly depolarized Em, reduced AP amplitude, prolonged AP duration at 90% repolarization (APD90), suppressed INaCa and depolarization-activated K+ currents, and reduced ATP levels in adult mouse cardiac myocytes. Treating cardiomyocytes with MB (20 µg/ml) 3 min after H2S exposure restored Em, APD90, INaCa, depolarization-activated K+ currents, and ATP levels toward normal. MB improved mitochondrial membrane potential (∆ψm) and oxygen consumption rate in myocytes in which Complex I was blocked by rotenone. We conclude that MB ameliorated H2S-induced cardiomyocyte toxicity at multiple levels: (1) reversing excitation-contraction coupling defects (Ca2+ homeostasis and L-type Ca2+ channels); (2) reducing risks of arrhythmias (Em, APD, INaCa and depolarization-activated K+ currents); and (3) improving cellular bioenergetics (ATP, ∆ψm).

Keywords: Arrhythmogenesis; Ion currents; Patch clamp; Sulfide toxicity.


Conflict of interest statement

Disclosures

No conflict of interest, financial and otherwise, is declared by the authors.

Figures

Figure 1
Figure 1
MB rescues contractile dysfunction of cardiomyocytes exposed to H2S: MB dose response. Freshly isolated myocytes from mouse LV and septum were plated on laminin-coated coverslips, bathed in medium 199 ([Ca2+]o 1.8 mM) and paced (2 Hz) to contract (37°C)(Methods). MB (0 to 500 μg/ml) or NaHS (100 μM) + MB (0 to 500 μg/ml) were added at time 0, and contractions were measured at 10 min. Maximal contraction amplitudes (% of resting cell length, %RCL) are shown for MB (□) and NaHS + MB (●) myocytes. For MB alone, there were 20, 7, 10, 6, 10, 8 and 6 myocytes at 0, 1, 5, 10, 20, 100 and 500 μg/ml, respectively. For NaHS + MB, there were 25, 8, 9, 8, 9, 7, and 8 myocytes at 0, 1, 5, 10, 20, 100 and 500 μg/ml of MB, respectively. Inset: expanded view of contractile response at MB doses from 0 to 20 μg/ml.
Figure 2
Figure 2
H2S depolarizes resting membrane potential (Em) and prolongs action potential duration (APD): rescue by MB. Em and APD were measured in myocytes isolated from mouse LV and septum with whole cell patch-clamp. Myocytes were paced at 1 Hz. Pipette solution consisted of (in mM) 125 KCl, 4 MgCl2, 0.06 CaCl2, 10 HEPES, 5 K+-EGTA, 3 Na2ATP, and 5 Na2-creatine phosphate (pH 7.2). External solution consisted of (in mM) 132 NaCl, 5.4 KCl, 1.8 CaCl2, 1.8 MgCl2, 0.6 NaH2PO4, 7.5 HEPES, 7.5 Na+-HEPES, and 5 glucose, pH 7.4. At time 0, either saline or NaHS (100 μM) was added followed by MB (20 μg/ml) or saline at 3 min before action potential was measured at 7 min. Top. Representative action potentials from myocytes treated with saline (control), MB alone, NaHS alone, and NaHS + MB recorded using current-clamp configuration at 1.5x threshold stimulus, 4-ms duration and at 30°C (75, 79, 96, 97). Bottom: Means ± SE of resting Em, action potential amplitude, action potential duration at 50% (APD50) and at 90% repolarization (APD90) from 5 control, 4 MB, 5 NaHS and 4 NaHS + MB myocytes are shown. * P<0.045, control vs. NaHS or NaHS + MB; + P<0.02, NaHS vs. NaHS + MB.
Figure 3
Figure 3
H2S inhibits Na+/Ca2+ exchanger current (INaCa): reversal by MB. Pipette solution contained (in mM) 100 Cs+ glutamate, 7.25 NaCl, 1 MgCl2, 20 HEPES, 2.5 Na2ATP, 10 EGTA and 6 CaCl2, pH 7.2. Free Ca2+ in the pipette solution was 205 nM, measured fluorimetrically with fura-2. External solution contained (in mM) 130 NaCl, 5 CsCl, 1.2 MgSO4, 1.2 NaH2PO4, 5 CaCl2, 10 HEPES, 10 Na+ HEPES and 10 glucose, pH 7.4. Verapamil (1 μM) was used to block ICa,L. Our measurement conditions were biased towards measuring outward (3 Na+ out: 1 Ca2+ in) INaCa. (A). After holding the myocyte at the calculated reversal potential (−73 mV) of INaCa for 5 min (to minimize fluxes through Na+/Ca2+ exchanger and thus allowed [Na+]i and [Ca2+]i to equilibrate with those in pipette solution), INaCa (30°C) was measured in myocytes using a descending (from +100 to −120 mV; 500 mV/s) – ascending (from −120 to +100 mV; 500 mV/s) voltage ramp, first in the absence and then in the presence of 1 mM NiCl2. (B). Raw currents measured in a WT myocyte. INaCa was defined as the difference current measured in the absence and presence of Ni+ during the descending voltage ramp. Note that with the exception of small contamination of the ascending ramp by the cardiac Na+ current, there were little to no differences in INaCa measured between the descending and ascending voltage ramps. This suggests that [Ca2+]i and [Na+]i sensed by Na+/Ca2+ exchanger did not appreciably change by ion fluxes during the brief (880 ms) voltage ramp. INaCa was divided by Cm prior to comparisons. (C). At time 0, either saline or NaHS (100 μM) was added followed by MB (20 μg/ml) or saline at 3 min before INaCa was measured at 7 min. Current-voltage relationships of INaCa (means ± SE) from control (▲; n=6), MB (●; n=3), NaHS (■; n=5) and NaHS + MB (◆; n=5) myocytes are shown. The reversal potential of INaCa was ~ −60 mV, close to the theoretical reversal potential of −73 mV. Error bars are not shown if they fall within the boundaries of the symbol.
Figure 4
Figure 4
H2S decreases depolarization-activated K+ currents: rescue by MB. Depolarization-activated K+ currents (30°C, 135 mM [K+]i) were measured in control (□; n=3), MB (▲; n=4), NaHS (◆; n=4) and NaHS + MB (○; n=3) myocytes isolated from the LV free wall (Methods). Top. Raw tracings of depolarization-activated K+ currents from control, MB, NaHS and NaHS + MB myocytes. K+ currents were separated into 3 components (Methods). Bottom. Current-voltage relationships of peak currents, fast component of transient outward currents (Ito,f), slowly inactivating K+ currents (IK,slow) and steady-state non-inactivating K+ currents (Iss) are shown. Values are means ± SE. Error bars are not shown if they fall within the boundaries of a symbol. Data for K+ currents are fitted by linear regression.
Figure 5
Figure 5
Effects on MB on cardiomyocyte bioenergetics: ATP levels, mitochondrial membrane potential (Δψm), and O2 consumption rate (OCR). (A). ATP (luminescence, relative light units) levels from LV myocytes treated with saline (CNTL, n=8), MB (n=8), NaHS (n=7) and MB + NaHS (n=7) for 10 min were determined with CellTiter-Glo luminescent cell viability kit (Methods). *p<0.0005, CNTL vs. NaHS; #p<0.03; CNTL vs. MB. There are no differences in ATP levels between CNTL and NaHS + MB myocytes (p=0.53). (B). LV myocytes were permeabilized with digitonin and supplemented with succinate. Left: the ratiometric indicator JC-1 was added at 20s and used to monitor Δψm. Arrows indicate addition of JC-1 and the mitochondrial uncoupler CCCP (2 μM), respectively. Rotenone (10 nM) and/or MB (20 μg/ml) were added at time 0. Right: Summary of Δψm before CCCP addition (n=3 each). **p<0.01; ns, not significant. (C). OCR was measured in intact myocytes (Methods). After basal OCR was obtained, either saline control (●), MB alone (20 μg/ml; ○), rotenone (1 μM; □), or MB (20 μg/ml) + rotenone (■) were added (indicated by “Compound”). At times indicated, oligomycin (1 μM) was added to inhibit F0F1ATPase (Complex V) followed by addition of the uncoupler FCCP (1 μM) to measure maximal OCR. Finally, antimycin A + rotenone (1 μM each) were added to inhibit cytochrome bc1 complex (Complex III) and NADH dehydrogenase (Complex I), respectively. Each point in the traces represents the average of 8 different wells. This experiment was repeated 3 times with similar results.

References

    1. Almeida AF, Guidotti TL. Differential sensitivity of lung and brain to sulfide exposure: a peripheral mechanism for apnea. Toxicol Sci. 1999;50:287–293. - PubMed
    1. Almgren T, Dyrssen D, Elgquist B, Johannsson O. Dissociation of hydrogen sulfide in seawater and comparison of pH scales. Marine Chemistry. 1976;4:289–297.
    1. Arnold IM, Dufresne RM, Alleyne BC, Stuart PJ. Health implication of occupational exposures to hydrogen sulfide. J Occup Med. 1985;27:373–376. - PubMed
    1. Ash-Bernal R, Wise R, Wright SM. Acquired methemoglobinemia: a retrospective series of 138 cases at 2 teaching hospitals. Medicine (Baltimore) 2004;83:265–273. - PubMed
    1. Astier A, Baud FJ. Complexation of intracellular cyanide by hydroxocobalamin using a human cellular model. Human & experimental toxicology. 1996;15:19–25. - PubMed

Publication types

MeSH terms