. 2018 Jun;47(3):157-171.
doi: 10.1111/jmp.12340. Epub 2018 Mar 30.

The non-human primate kidney transcriptome in fetal development

Affiliations

The non-human primate kidney transcriptome in fetal development

Kimberly D Spradling-Reeves et al. J Med Primatol. 2018 Jun.

Abstract

Background: Little is known about the repertoire of non-human primate kidney genes expressed throughout development. The present work establishes an understanding of the primate renal transcriptome during fetal development in the context of renal maturation.

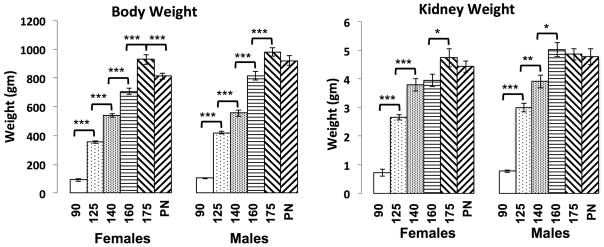
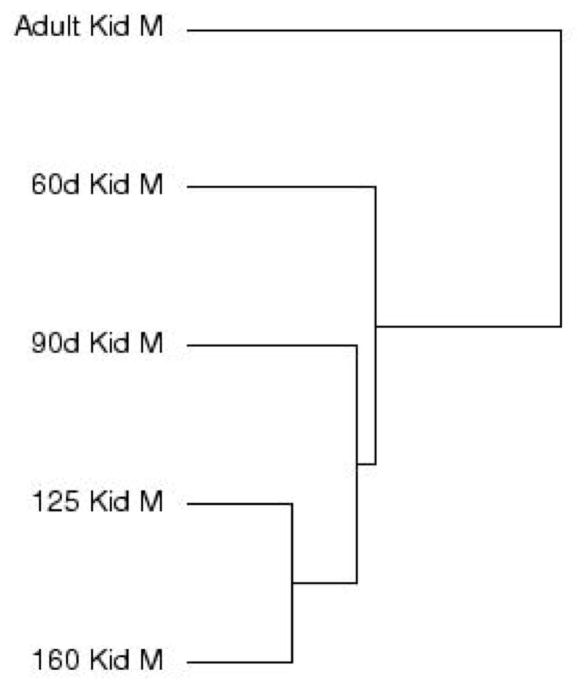
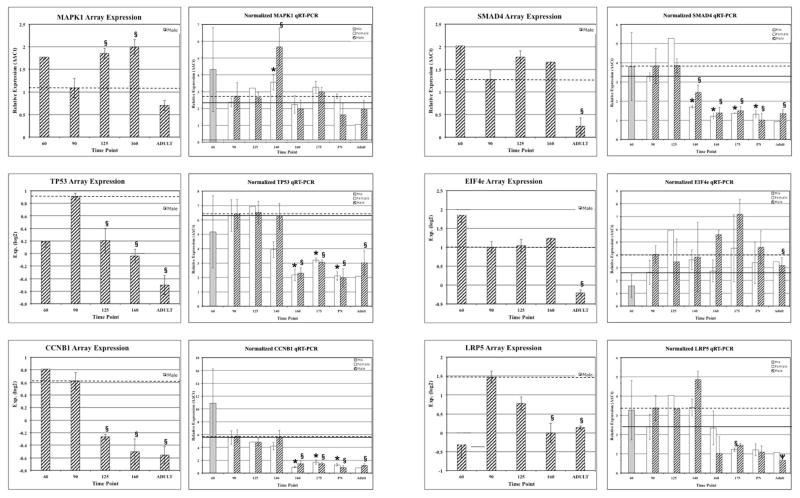
Methods: The baboon kidney transcriptome was characterized at 60-day gestation (DG), 90 DG, 125 DG, 140 DG, 160 DG and adulthood (6-12 years) using gene arrays and validated by QRT-PCR. Pathway and cluster analyses were used to characterize gene expression in the context of biological pathways.

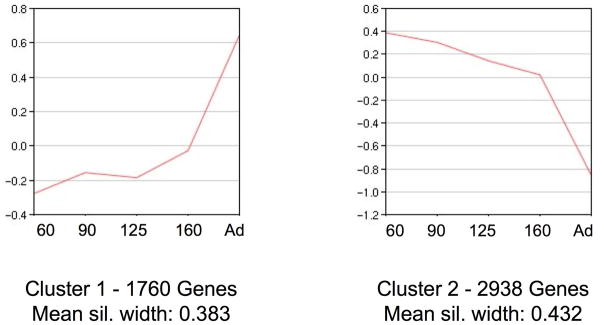
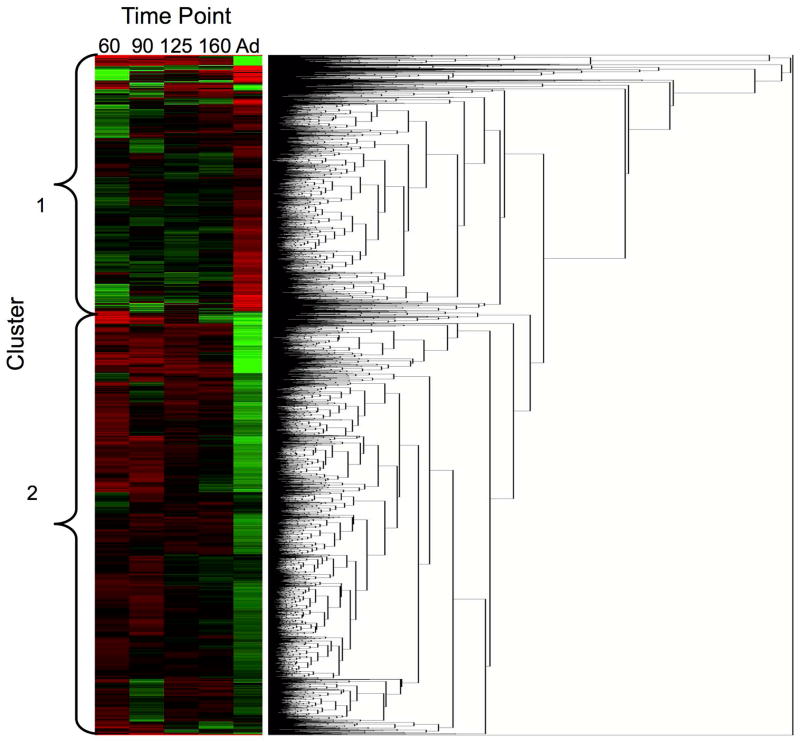
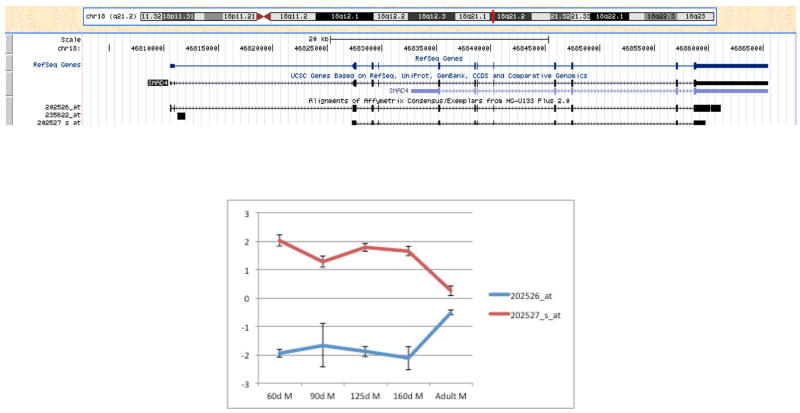
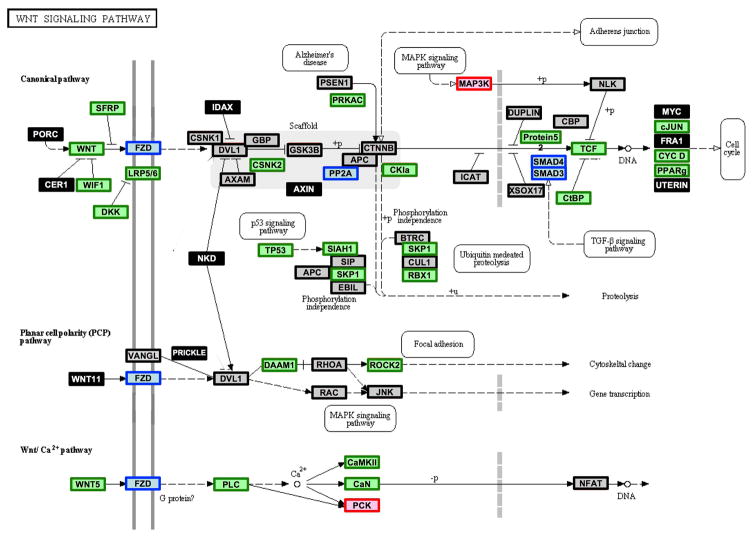
Results: Pathway analysis indicated activation of pathways not previously reported as relevant to kidney development. Cluster analysis also revealed gene splice variants with discordant expression profiles during development.

Conclusions: This study provides the first detailed genetic analysis of the developing primate kidney, and our findings of discordant expression of gene splice variants suggest that gene arrays likely provide a simplified view and demonstrate the need to study the fetal renal proteome.

Keywords: array; baboon; cluster analysis; gene expression; ontogeny; pathway analysis.


Figures

Figure 1
Figure 1. Kidney and body weight measures during baboon development
A) body weights and B) kidney weights for females and males at 90DG, 125DG, 140DG, 160DG, 175DG and PN2 are shown in gm. The * denotes p < 0.05, ** denotes p < 0.01 and *** denotes p < 0.001.
Figure 2
Figure 2. Cluster analysis of gene expression data
Similarities are denoted by the lengths of the horizontal lines in arbitrary units. For 60d, n=3, 1 male, 2 undetermined; for 90d – Adult, n=3 males per group.
Figure 3
Figure 3. Cluster analysis of gene expression for differentially expressed genes
The lines represent the median gene expression value for all genes in that cluster. The y-axis denotes the relative gene expression value (log2-transformed), and the x-axis shows the time points included in the gene array expression analysis. A) Cluster 1 consists of 1,760 genes and has a mean silhouette width of 0.383. B) Cluster 2 consists of 2,938 genes and has a mean silhouette width of 0.432. For 60d, n=3, 1 male, 2 undetermined; for 90d – Adult, n=3 males per group.
Figure 4
Figure 4. Heat map of cluster analysis
Each column represents one time point, and each row represents expression of a specific gene. Genes are clustered by expression profiles for all time points. Clusters are indicated to the left of the heat map. For 60d, n=3, 1 male, 2 undetermined; for 90d – Adult, n=3 males per group.
Figure 5
Figure 5. Validation of gene array expression profiles by QRT-PCR
Gene expression profiles for MAPK1, TP53, CCNG1, SMAD4, EIF4E and LRP5 are shown. The left graph shows the array data, and the right graph shows the QRT-PCR data. For gene array graphs, relative expression of log2-transformed values are shown. For QRT-PCR graphs, RQ values are shown on the y-axis. The time points are shown on the x-axis. Females are shown with white bars and males with hashed bars. The * denotes p < 0.05 for comparison with 90d for females and § denotes p<0.05 and Ψ denotes p=0.06 for comparison with 90d for males. For 60d, n=3, 1 male, 2 undetermined; 90d, 140d, 160d, 175d, PN and Adult, n=3 females and n=3 males per group; and 125d n=2 females and n=3 males per group.
Figure 6
Figure 6. Gene array expression of two SMAD4 splice variants
A) The SMAD4 gene alignment showing the splice variants of the gene detected by each specific Affymetrix probe are shown (UCSC Genome Browser, (26)). B) Expression profiles for the two SMAD4 splice variants detected on the gene array. For 60d, n=3, 1 male, 2 undetermined; for 90d – Adult, n=3 males per group.
Figure 7
Figure 7. WNT signaling pathway annotated by clusters
Genes that are differentially expressed and included in cluster 1, which are up-regulated from 60DG to adult, are denoted by red boxes; genes that are differentially expressed and included in cluster 2, which are down-regulated from 60DG to adult, are denoted by green boxes; genes that are differentially expressed and gene splice variants or gene family members are found in cluster 1 and cluster 2 are denoted by blue boxes; genes that are not differentially expressed are denoted by gray boxes with black lines; and genes that were not detected on the array are denoted by black boxes with white font. This pathway was modified from the original KEGG pathway by adding color annotation. For 60d, n=3, 1 male, 2 undetermined; for 90d – Adult, n=3 males per group.

Similar articles

Cited by

References

    1. Ingelfinger JR, Woods LL. Perinatal programming, renal development, and adult renal function. American Journal of Hypertension. 2002 Feb;15(2 Pt 2):46S–9S. - PubMed
    1. Rasch R, Skriver E, Woods LL. The role of the RAS in programming of adult hypertension. Acta Physiologica Scandinavica. 2004 Aug;181(4):537–42. - PubMed
    1. Schwab K, Patterson LT, Aronow BJ, Luckas R, Liang H-C, Potter SS. A catalogue of gene expression in the developing kidney. Kidney Int. 2003 Nov;64(5):1588–604. - PubMed
    1. McMahon AP, Aronow BJ, Davidson DR, Davies JA, Gaido KW, Grimmond S, et al. GUDMAP: The genitourinary developmental molecular anatomy project. J Am Soc Nephrol. 2008 Apr;19(4):667–71. - PubMed
    1. Potter SS, Brunskill EW, Patterson LT. Microdissection of the gene expression codes driving nephrogenesis. Organogenesis. 2010;6(4):263–9. - PMC - PubMed

Publication types

Associated data