

Age-specific pediatric reference ranges for immunoglobulins and complement proteins on the Optilite™ automated turbidimetric analyzer
- PMID: 29603375
- PMCID: PMC6817213
- DOI: 10.1002/jcla.22420
Age-specific pediatric reference ranges for immunoglobulins and complement proteins on the Optilite™ automated turbidimetric analyzer
Abstract
Background: Measurement of immunoglobulins and complement proteins are frontline tests used in the assessment of immune system integrity, and reference values can vary with age. Their measurement provides an insight into the function of the innate and adaptive immune systems.
Methods: We generated pediatric reference ranges for IgG, IgA, IgM, IgD, the IgG and IgA subclasses, and C3 and C4 using the Optilite™ turbidimetric analyzer.
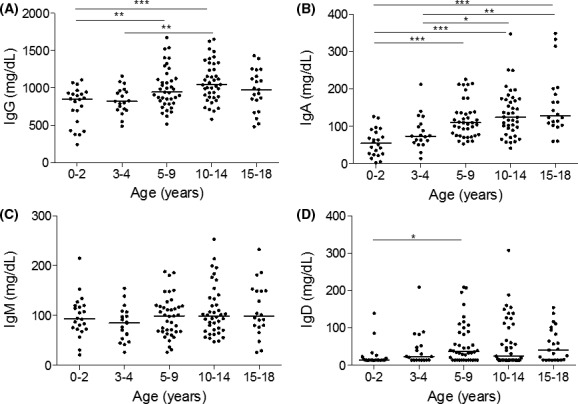
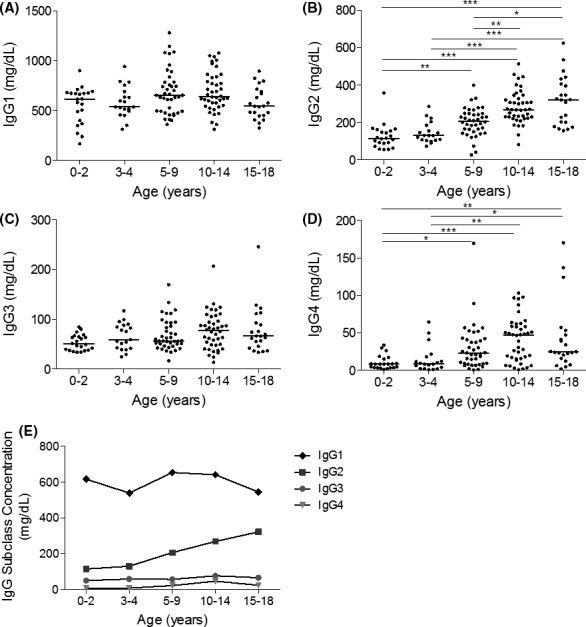
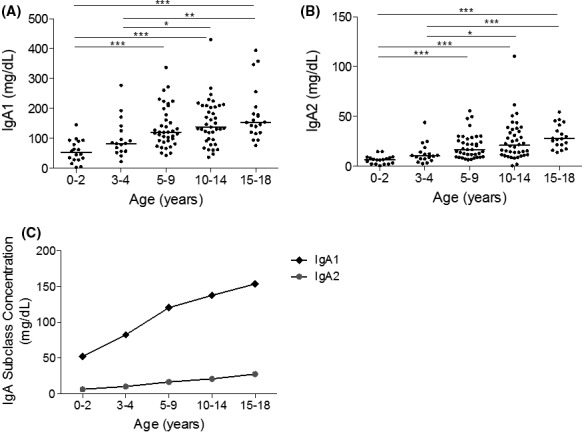
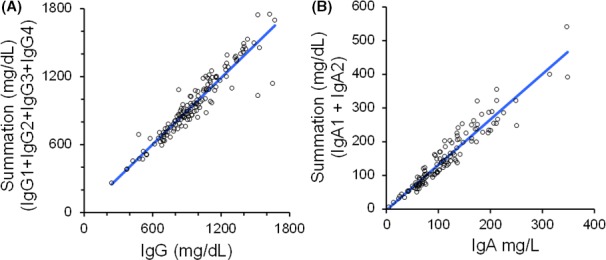
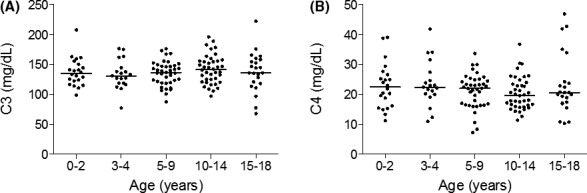
Results: The concentrations of IgG, IgA, and IgD showed an increase with age, as expected, while IgM remained stable between the age groups. For the IgG subclasses, no significant differences were observed in IgG1 or IgG3, while IgG2 and IgG4 concentrations increased steadily with age. The concentration of IgG2 plateaued at 15-18 years, while IgG4 plateaued at 10-14 years. The trend of concentrations across all groups was IgG1 > IgG2 > IgG3 > IgG4. For both IgA1 and IgA2, concentrations increased significantly with age, plateauing at 15-18 years. The median IgA1 concentration was greater than IgA2 across all groups. There was a good correlation between the total IgG or IgA concentration and summation of their subclasses (R2 = 0.89, P < .0001, slope y = 0.98x + 14.51 mg/dL and R2 = 0.91, P < .0001, slope y = 1.35x-3.28 mg/dL, respectively). The concentration of C3 and C4 remained stable across the groups, with no significant differences observed.
Conclusion: We have generated age-specific reference ranges in healthy children for C3, C4, IgG, IgA, IgM, IgD and the IgG and IgA subclasses using the Optilite™ turbidimetric analyzer. These ranges will help identify individuals with abnormal concentrations, thus will aid in the diagnosis of both primary and secondary immunological disorders.
Keywords: complement system proteins; immunodeficiency; immunoglobulins; pediatric reference values; turbidimetry.
© 2018 Wiley Periodicals, Inc.
Figures
References
-
- Perlmutter DH, Colten HR. Molecular immunobiology of complement biosynthesis: a model of single‐cell control of effector‐inhibitor balance. Annu Rev Immunol. 1986;4:231‐251. - PubMed
-
- Alberts B. Molecular Biology of the Cell. 4th edn. New York, NY: Garland Science; 2002:xxxiv, 1548
-
- Song WC, Sarrias MR, Lambris JD. Complement and innate immunity. Immunopharmacology. 2000;49:187‐198. - PubMed
Grants and funding
LinkOut - more resources
Full Text Sources
Other Literature Sources
Miscellaneous
