

Racial/ethnic disparities in waitlisting for deceased donor kidney transplantation 1 year after implementation of the new national kidney allocation system
- PMID: 29603644
- PMCID: PMC6105401
- DOI: 10.1111/ajt.14748
Racial/ethnic disparities in waitlisting for deceased donor kidney transplantation 1 year after implementation of the new national kidney allocation system
Abstract
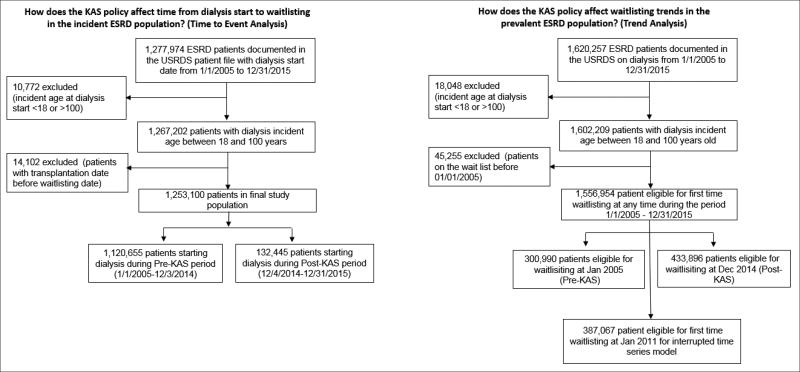
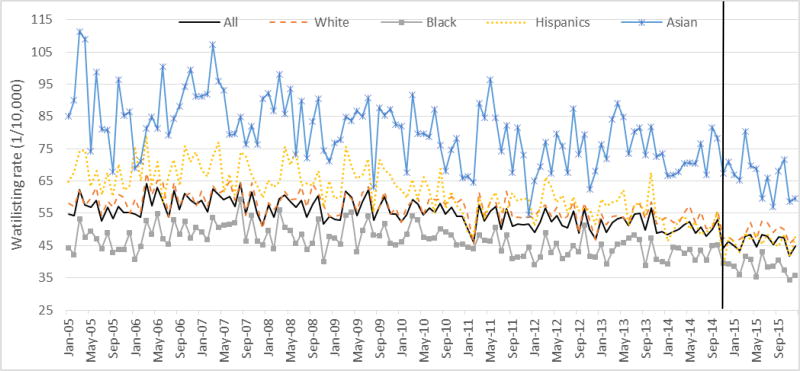
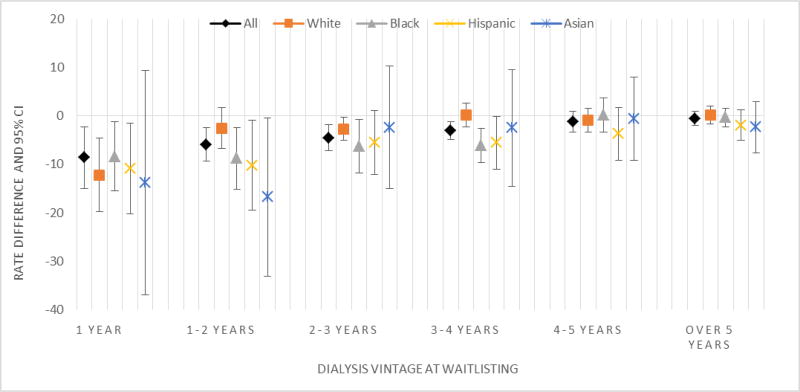
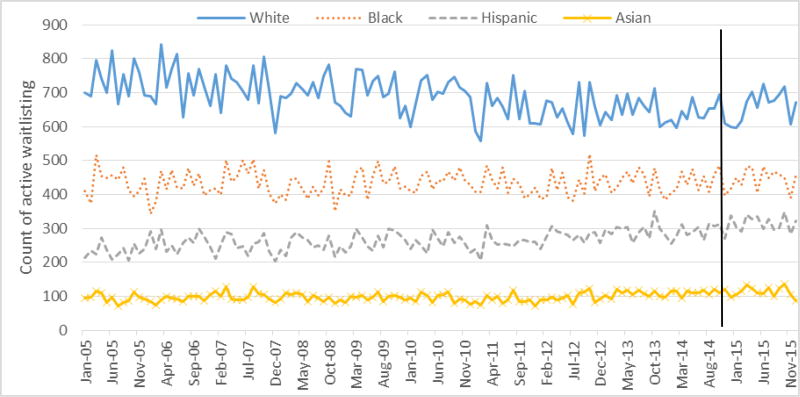
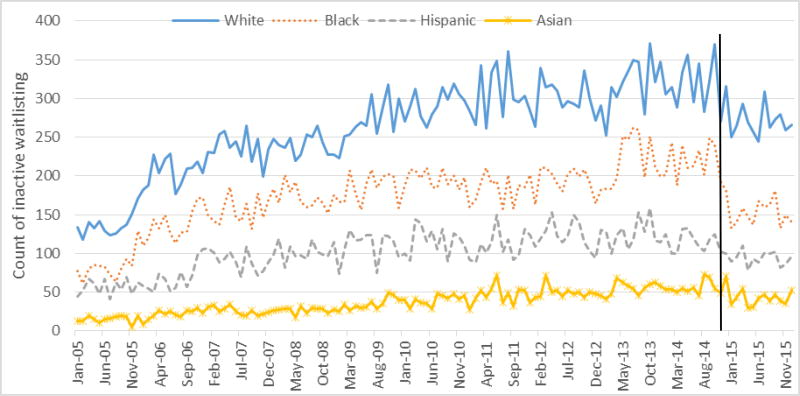
The impact of a new national kidney allocation system (KAS) on access to the national deceased-donor waiting list (waitlisting) and racial/ethnic disparities in waitlisting among US end-stage renal disease (ESRD) patients is unknown. We examined waitlisting pre- and post-KAS among incident (N = 1 253 100) and prevalent (N = 1 556 954) ESRD patients from the United States Renal Data System database (2005-2015) using multivariable time-dependent Cox and interrupted time-series models. The adjusted waitlisting rate among incident patients was 9% lower post-KAS (hazard ratio [HR]: 0.91; 95% confidence interval [CI], 0.90-0.93), although preemptive waitlisting increased from 30.2% to 35.1% (P < .0001). The waitlisting decrease is largely due to a decline in inactively waitlisted patients. Pre-KAS, blacks had a 19% lower waitlisting rate vs whites (HR: 0.81; 95% CI, 0.80-0.82); following KAS, disparity declined to 12% (HR: 0.88; 95% CI, 0.85-0.90). In adjusted time-series analyses of prevalent patients, waitlisting rates declined by 3.45/10 000 per month post-KAS (P < .001), resulting in ≈146 fewer waitlisting events/month. Shorter dialysis vintage was associated with greater decreases in waitlisting post-KAS (P < .001). Racial disparity reduction was due in part to a steeper decline in inactive waitlisting among minorities and a greater proportion of actively waitlisted minority patients. Waitlisting and racial disparity in waitlisting declined post-KAS; however, disparity remains.
Keywords: epidemiology; ethics and public policy; ethnicity/race; health services and outcomes research; kidney transplantation/nephrology; organ allocation; organ procurement and allocation; quality of care/care delivery.
© 2018 The American Society of Transplantation and the American Society of Transplant Surgeons.
Conflict of interest statement
Figures
Similar articles
-
Impact of the new kidney allocation system A2/A2B → B policy on access to transplantation among minority candidates.Am J Transplant. 2018 Aug;18(8):1947-1953. doi: 10.1111/ajt.14719. Epub 2018 Mar 31. Am J Transplant. 2018. PMID: 29509285 Free PMC article.
-
Measuring and monitoring equity in access to deceased donor kidney transplantation.Am J Transplant. 2018 Aug;18(8):1924-1935. doi: 10.1111/ajt.14922. Epub 2018 Jun 1. Am J Transplant. 2018. PMID: 29734498
-
Obesity and gender-biased access to deceased donor kidney transplantation.Nephrol Dial Transplant. 2020 Jan 1;35(1):184-189. doi: 10.1093/ndt/gfz100. Nephrol Dial Transplant. 2020. PMID: 31203364
-
Progress made toward equitable transplantation in children and young adults with kidney disease.Pediatr Nephrol. 2024 Sep;39(9):2593-2600. doi: 10.1007/s00467-024-06309-5. Epub 2024 Feb 12. Pediatr Nephrol. 2024. PMID: 38347281 Review.
-
The UNOS Renal Transplant Registry: Review of the Last Decade.Clin Transpl. 2014:1-12. Clin Transpl. 2014. PMID: 26281122 Review.
Cited by
-
Implementation of the ASCENT Trial to Improve Transplant Waitlisting Access.Kidney Int Rep. 2023 Nov 2;9(2):225-238. doi: 10.1016/j.ekir.2023.10.028. eCollection 2024 Feb. Kidney Int Rep. 2023. PMID: 38344743 Free PMC article.
-
Racial/Ethnic Inequities in Access to High-Quality Dialysis Treatment in Chicago: Does Neighborhood Racial/Ethnic Composition Matter?J Racial Ethn Health Disparities. 2020 Oct;7(5):854-864. doi: 10.1007/s40615-020-00708-8. Epub 2020 Feb 5. J Racial Ethn Health Disparities. 2020. PMID: 32026285 Free PMC article.
-
Reassessing the Inclusion of Race in Diagnosing Kidney Diseases: An Interim Report From the NKF-ASN Task Force.Am J Kidney Dis. 2021 Jul;78(1):103-115. doi: 10.1053/j.ajkd.2021.03.008. Epub 2021 Apr 9. Am J Kidney Dis. 2021. PMID: 33845065 Free PMC article.
-
Divergent Trends by Patient Age in Racial Disparities in Kidney Transplant Access.Kidney Int Rep. 2025 Jun 4;10(8):2766-2777. doi: 10.1016/j.ekir.2025.05.045. eCollection 2025 Aug. Kidney Int Rep. 2025. PMID: 40814646 Free PMC article.
-
Lost in Transplantation: Characterizing Racial Gaps in Physician Organ Offer Acceptance.medRxiv [Preprint]. 2024 Jul 16:2024.07.14.24310395. doi: 10.1101/2024.07.14.24310395. medRxiv. 2024. PMID: 39072010 Free PMC article. Preprint.
References
-
- Danovitch GM. Handbook of kidney transplantation. Lippincott Williams & Wilkins; 2009.
-
- Wu DA, Watson CJ, Bradley JA, Johnson RJ, Forsythe JL, Oniscu GC. Global trends and challenges in deceased donor kidney allocation. Kidney International. 2017 - PubMed
-
- USRDS. United States Renal Data System, 2017 Annual Data Report: An overview of the epidemiology of kidney disease in the United States. Bethesda, MD: National Institutes of Health, National Institute of Diabetes and Digestive and Kidney Diseases; 2017.
-
- Network OPaT. Current United States Kidney Transplant Waiting List Data. 2017
-
- Medicine Io. Organ Procurement and Transplantation: Assessing Current Policies and the Potential Impact of the DHHS Final Rule. Washington, DC: The National Academies Press; 1999. - PubMed
Publication types
MeSH terms
Grants and funding
LinkOut - more resources
Full Text Sources
Other Literature Sources
Medical
