

Initiation and slow propagation of epileptiform activity from ventral to dorsal medial entorhinal cortex is constrained by an inhibitory gradient
- PMID: 29604046
- PMCID: PMC5983178
- DOI: 10.1113/JP275871
Initiation and slow propagation of epileptiform activity from ventral to dorsal medial entorhinal cortex is constrained by an inhibitory gradient
Abstract
Key points: The medial entorhinal cortex (mEC) has an important role in initiation and propagation of seizure activity. Several anatomical relationships exist in neurophysiological properties of mEC neurons; however, in the context of hyperexcitability, previous studies often considered it as a homogeneous structure. Using multi-site extracellular recording techniques, ictal-like activity was observed along the dorso-ventral axis of the mEC in vitro in response to various ictogenic stimuli. This originated predominantly from ventral areas, spreading to dorsal mEC with a surprisingly slow velocity. Modulation of inhibitory tone was capable of changing the slope of ictal initiation, suggesting seizure propagation behaviours are highly dependent on levels of GABAergic function in this region. A distinct disinhibition model also showed, in the absence of inhibition, a prevalence for interictal-like initiation in ventral mEC, reflecting the intrinsic differences in mEC neurons. These findings suggest the ventral mEC is more prone to hyperexcitable discharge than the dorsal mEC, which may be relevant under pathological conditions.
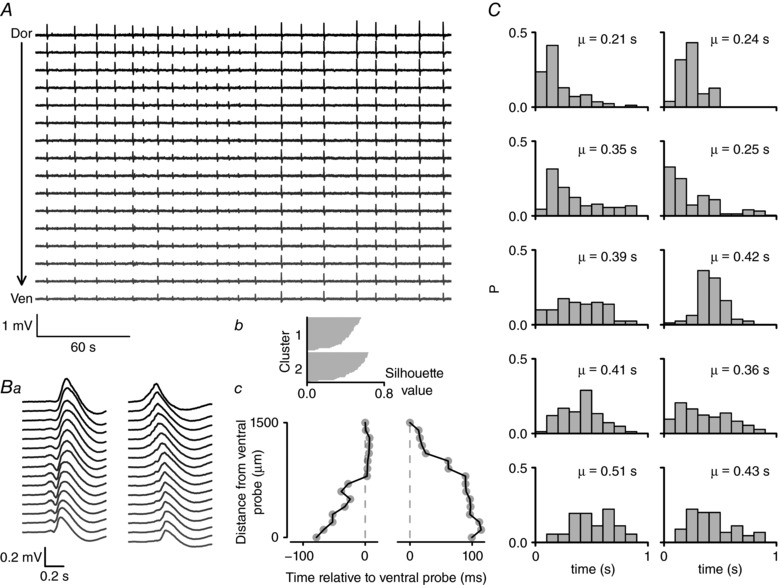
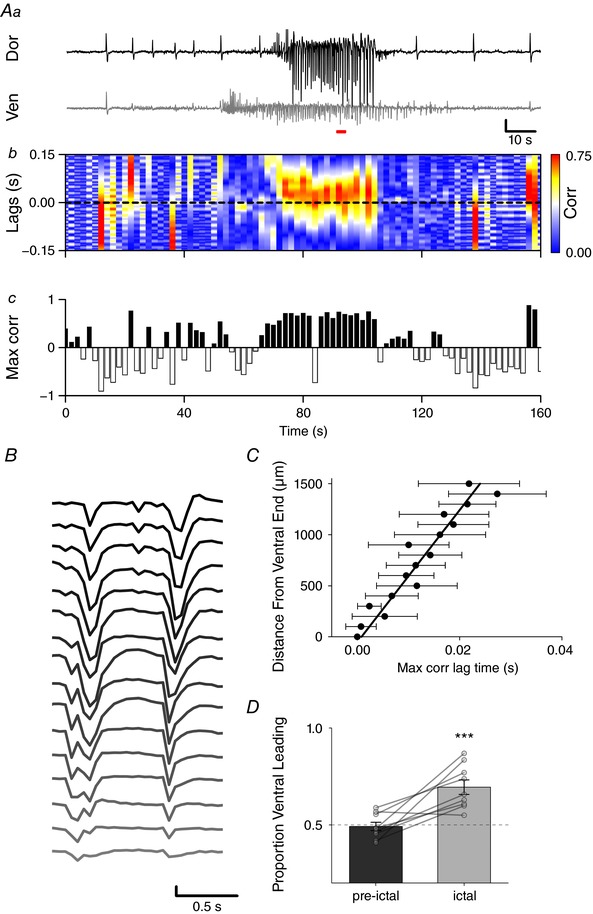
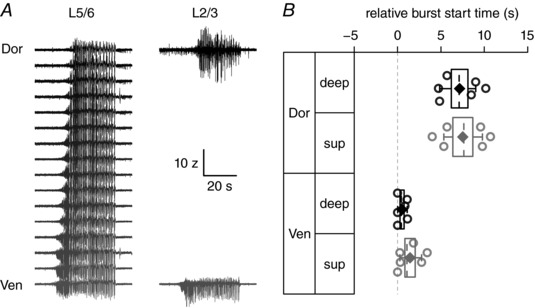
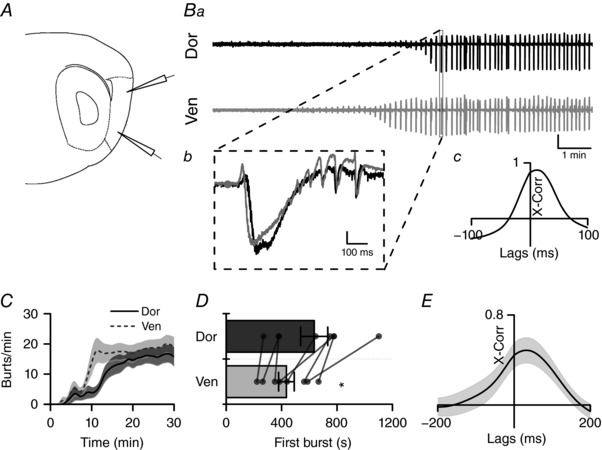
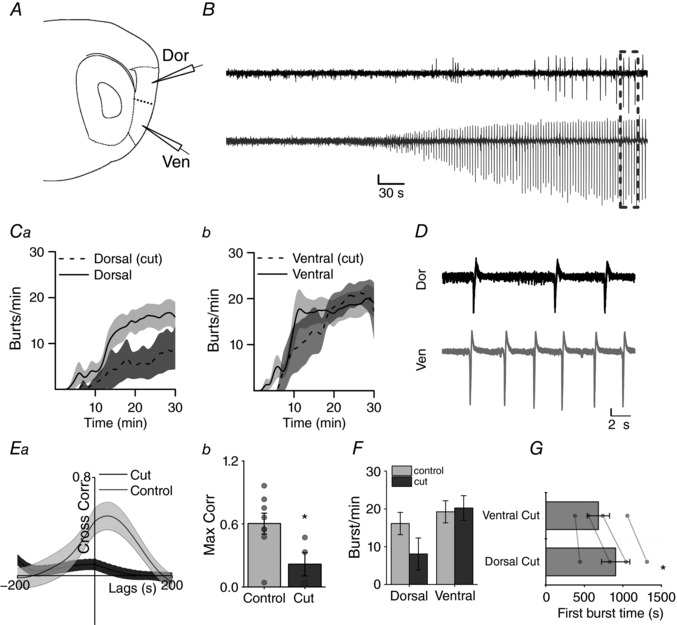
Abstract: The medial entorhinal cortex (mEC) has an important role in the generation and propagation of seizure activity. The organization of the mEC is such that a number of dorso-ventral relationships exist in neurophysiological properties of neurons. These range from intrinsic and synaptic properties to density of inhibitory connectivity. We examined the influence of these gradients on generation and propagation of epileptiform activity in the mEC. Using a 16-shank silicon probe array to record along the dorso-ventral axis of the mEC in vitro, we found 4-aminopyridine application produces ictal-like activity originating predominantly in ventral areas. This activity spreads to dorsal mEC at a surprisingly slow velocity (138 μm s-1 ), while cross-site interictal-like activity appeared relatively synchronous. We propose that ictal propagation is constrained by differential levels of GABAergic control since increasing (diazepam) or decreasing (Ro19-4603) GABAA receptor activation, respectively, reduced or increased the slope of ictal initiation. The observation that ictal activity is predominately generated in ventral mEC was replicated using a separate 0-Mg2+ model of epileptiform activity in vitro. By using a distinct disinhibition model (co-application of kainate and picrotoxin) we show that additional physiological features (for example intrinsic properties of mEC neurons) still produce a prevalence for interictal-like initiation in ventral mEC. These findings suggest that the ventral mEC is more likely to initiate hyperexcitable discharges than the dorsal mEC, and that seizure propagation is highly dependent on levels of GABAergic expression across the mEC.
Keywords: dorsal-Ventral gradient; entorhinal cortex; hyperexcitability.
© 2018 The Authors. The Journal of Physiology © 2018 The Physiological Society.
Figures


Comment in
-
Stress-testing the brain to understand its breaking points.J Physiol. 2018 Jun;596(11):2033-2034. doi: 10.1113/JP276184. Epub 2018 Apr 24. J Physiol. 2018. PMID: 29604061 Free PMC article. No abstract available.
Similar articles
-
Initiation of electrographic seizures by neuronal networks in entorhinal and perirhinal cortices in vitro.Neuroscience. 2004;123(4):875-86. doi: 10.1016/j.neuroscience.2003.11.013. Neuroscience. 2004. PMID: 14751281
-
Physiological Properties of Neurons in Bat Entorhinal Cortex Exhibit an Inverse Gradient along the Dorsal-Ventral Axis Compared to Entorhinal Neurons in Rat.J Neurosci. 2016 Apr 20;36(16):4591-9. doi: 10.1523/JNEUROSCI.1791-15.2016. J Neurosci. 2016. PMID: 27098700 Free PMC article.
-
Electrical and Network Neuronal Properties Are Preferentially Disrupted in Dorsal, But Not Ventral, Medial Entorhinal Cortex in a Mouse Model of Tauopathy.J Neurosci. 2016 Jan 13;36(2):312-24. doi: 10.1523/JNEUROSCI.2845-14.2016. J Neurosci. 2016. PMID: 26758825 Free PMC article.
-
Do interictal discharges promote or control seizures? Experimental evidence from an in vitro model of epileptiform discharge.Epilepsia. 2001;42 Suppl 3:2-4. doi: 10.1046/j.1528-1157.2001.042suppl.3002.x. Epilepsia. 2001. PMID: 11520313 Review.
-
Interictal-ictal interactions and limbic seizure generation.Rev Neurol (Paris). 1999 Jul;155(6-7):468-71. Rev Neurol (Paris). 1999. PMID: 10472661 Review.
Cited by
-
Ictal wavefront propagation in slices and simulations with conductance-based refractory density model.PLoS Comput Biol. 2022 Jan 18;18(1):e1009782. doi: 10.1371/journal.pcbi.1009782. eCollection 2022 Jan. PLoS Comput Biol. 2022. PMID: 35041661 Free PMC article.
-
The 4-Aminopyridine Model of Acute Seizures in vitro Elucidates Efficacy of New Antiepileptic Drugs.Front Neurosci. 2019 Jun 27;13:677. doi: 10.3389/fnins.2019.00677. eCollection 2019. Front Neurosci. 2019. PMID: 31316344 Free PMC article.
-
Stress-testing the brain to understand its breaking points.J Physiol. 2018 Jun;596(11):2033-2034. doi: 10.1113/JP276184. Epub 2018 Apr 24. J Physiol. 2018. PMID: 29604061 Free PMC article. No abstract available.
-
A large-scale brain network mechanism for increased seizure propensity in Alzheimer's disease.PLoS Comput Biol. 2021 Aug 11;17(8):e1009252. doi: 10.1371/journal.pcbi.1009252. eCollection 2021 Aug. PLoS Comput Biol. 2021. PMID: 34379638 Free PMC article.
-
Domino-like transient dynamics at seizure onset in epilepsy.PLoS Comput Biol. 2020 Sep 28;16(9):e1008206. doi: 10.1371/journal.pcbi.1008206. eCollection 2020 Sep. PLoS Comput Biol. 2020. PMID: 32986695 Free PMC article.
References
-
- Amaral D & Witter M (1989). The three‐dimensional organization of the hippocampal formation: a review of anatomical data. Neuroscience 31, 571–591. - PubMed
-
- Armand V, Rundfeldt C & Heinemann U (2000). Effects of retigabine (D‐23129) on different patterns of epileptiform activity induced by low magnesium in rat entorhinal cortex hippocampal slices. Epilepsia 41, 28–33. - PubMed
-
- Avoli M, D'Antuono M, Louvel J, Köhling R, Biagini G, Pumain R, D'Arcangelo G & Tancredi V (2002). Network and pharmacological mechanisms leading to epileptiform synchronization in the limbic system in vitro. Prog Neurobiol 68, 167–207. - PubMed
Publication types
MeSH terms
LinkOut - more resources
Full Text Sources
Other Literature Sources
Medical