. 2018 Aug;596(15):3391-3410.
doi: 10.1113/JP275945. Epub 2018 May 13.

Moderate and severe hypoxia elicit divergent effects on cardiovascular function and physiological rhythms

Affiliations

Moderate and severe hypoxia elicit divergent effects on cardiovascular function and physiological rhythms

Melissa A Allwood et al. J Physiol. 2018 Aug.

Abstract

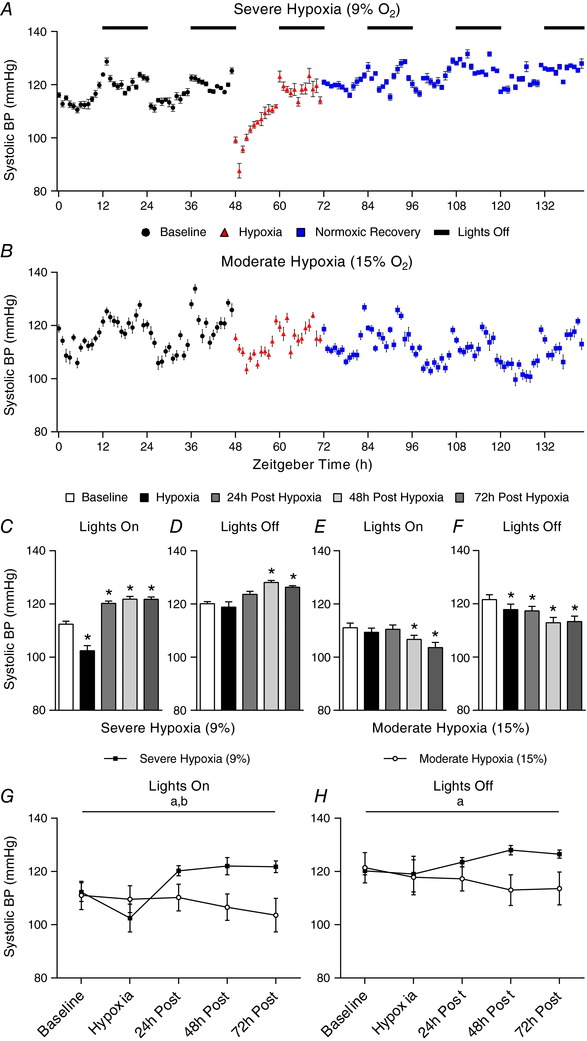
Key points: In the present study, we provide evidence for divergent physiological responses to moderate compared to severe hypoxia, addressing an important knowledge gap related to severity, duration and after-effects of hypoxia encountered in cardiopulmonary situations. The physiological responses to moderate and severe hypoxia were not proportional, linear or concurrent with the time-of-day. Hypoxia elicited severity-dependent physiological responses that either persisted or fluctuated throughout normoxic recovery. The physiological basis for these distinct cardiovascular responses implicates a shift in the sympathovagal set point and probably not molecular changes at the artery resulting from hypoxic stress.

Abstract: Hypoxia is both a consequence and cause of many acute and chronic diseases. Severe hypoxia causes hypertension with cardiovascular sequelae; however, the rare studies using moderate severities of hypoxia indicate that it can be beneficial, suggesting that hypoxia may not always be detrimental. Comparisons between studies are difficult because of the varied classifications of hypoxic severities, methods of delivery and use of anaesthetics. Thus, to investigate the long-term effects of moderate hypoxia on cardiovascular health, radiotelemetry was used to obtain in vivo physiological measurements in unanaesthetized mice during 24 h of either moderate (FIO2=0.15) or severe (FIO2=0.09) hypoxia, followed by 72 h of normoxic recovery. Systolic blood pressure was decreased during recovery following moderate hypoxia but increased following severe hypoxia. Moderate and severe hypoxia increased haeme oxygenase-1 expression during recovery, suggesting parity in hypoxic stress at the level of the artery. Severe but not moderate hypoxia increased the low/high frequency ratio of heart rate variability 72 h post-hypoxia, indicating a shift in sympathovagal balance. Moderate hypoxia dampened the amplitude of circadian rhythm, whereas severe disrupted rhythm during the entire insult, with perturbations persisting throughout normoxic recovery. Thus, hypoxic severity differentially regulates circadian blood pressure.

Keywords: Blood Pressure; Heart Rate Variability; Telemetry.


Figures

Figure 1
Figure 1. Experimental set‐up
Hypoxia chamber and telemetry unit set‐up. [Color figure can be viewed at http://wileyonlinelibrary.com]
Figure 2
Figure 2. Physiological responses of body temperature during baseline, severe or moderate hypoxia, and 72 hours of normoxic recovery
Hourly averages for severe (A) or moderate (B) hypoxia experiments. Average body temperatures recorded following normoxia, severe hypoxia, 24 h post‐hypoxia, 48 h post‐hypoxia and 72 h post‐hypoxia during lights on (C) (χ2 = 235.3, d.f. = 4, P < 0.0001) and lights off (D) (F 4,316 = 269.8, P < 0.0001). Average body temperatures recorded following baseline, moderate hypoxia, 24 h post‐hypoxia, 48 h post‐hypoxia and 72 h post‐hypoxia during lights on (E) (χ2 = 23.4, d.f. = 4, P = 0.0001) and lights off (F) (F 4,316 = 7.4, P < 0.0001). Two‐way ANOVA of body temperature during lights on (G) (interaction F 4,56 = 94.0, P < 0.0001; main effect of time F 4,56 = 113.1, P < 0.0001; main effect of group F 1,14 = 1.1, P = 0.3158) and lights off (H) (interaction F 4,56 = 20.8, P < 0.0001; main effect of time F 4,56 = 29.8, P < 0.0001; main effect of group F 1,14 = 0.1, P = 0.7579). For panels (C) to (F): * P < 0.05 compared to baseline. For panels (G) and (H): a, significant interaction; b, significant main effect of time; P < 0.05 compared to moderate hypoxia at the same time point. Values expressed are the mean ± SEM (n = 8 per group). Note: y‐axes for (A) and (B) are broader than (C) to (H) for visual clarity. [Color figure can be viewed at http://wileyonlinelibrary.com]
Figure 3
Figure 3. Cosinor analysis of severe hypoxia
Graphical representation of cosinor analysis of severe hypoxia (9% O2).
Figure 4
Figure 4. Cosinor analysis of moderate hypoxia
Graphical representation of cosinor analysis of moderate hypoxia (15% O2).
Figure 5
Figure 5. Physiological responses of activity during baseline, severe or moderate hypoxia, and 72 hours of normoxic recovery
Hourly averages for severe (A) and moderate (B) hypoxia experiments. Average activity recorded following baseline, severe hypoxia, 24 h post‐hypoxia, 48 h post‐hypoxia and 72 h post‐hypoxia during lights on (C) (χ2 = 80.7, d.f. = 4, P < 0.0001) and lights off (D) (χ2 = 112.8, d.f. = 4, P < 0.0001). Average body temperatures recorded following baseline, moderate hypoxia, 24 h post‐hypoxia, 48 h post‐hypoxia and 72 h post‐hypoxia during lights on (E) (χ2 = 14.7, d.f. = 4, P = 0.0055) and lights off (F) (χ2 = 10.1, d.f. = 4, P = 0.0396). Two‐way ANOVA of activity during lights on (G) (interaction F 4,56 = 4.0, P = 0.0062; main effect of time F 4,56 = 10.0, P < 0.0001; main effect of group F 1,14 = 1.3, P = 0.2791) and lights off (H) (interaction F 4,56 = 11.8, P < 0.0001; main effect of time F 4,56 = 13.5, P < 0.0001; main effect of group F 1,14 = 3.2, P = 0.0945). For panels (C) to (F): * P < 0.05 compared to baseline. For panels (G) and (H): a, significant interaction; b, significant main effect of time; P < 0.05 compared to moderate hypoxia at the same time point. Values expressed are the mean ± SEM (n = 8 per group). Note: y‐axes for (A) and (B) are broader than (C) to (H) for visual clarity. [Color figure can be viewed at http://wileyonlinelibrary.com]
Figure 6
Figure 6. Physiological responses of systolic blood pressure (SBP) during baseline, severe or moderate hypoxia, and 72 hours of normoxic recovery
Hourly averages for severe (A) and moderate (B) hypoxia experiments. Average SBP recorded following baseline, severe hypoxia, 24 h post‐hypoxia, 48 h post‐hypoxia and 72 h post‐hypoxia during lights on (C) (χ2 = 85.4, d.f. = 4, P < 0.0001) and lights off (D) (χ2 = 41.2, d.f. = 4, P < 0.0001). Average SBP recorded following baseline, moderate hypoxia, 24 h post‐hypoxia, 48 h post‐hypoxia and 72 h post‐hypoxia during lights on (E) (χ2 = 50.9, d.f. = 4, P < 0.0001) and lights off (F) (χ2 = 52.5, d.f. = 4, P < 0.0001). Two‐way ANOVA of SBP during lights on (G) (interaction F 4,24 = 11.5, P < 0.0001; main effect of time F 4,24 = 4.6, P = 0.0067; main effect of group F 1,6 = 1.4, P = 0.2779) and lights off (H) (interaction F 4,24 = 3.3, P = 0.0265; main effect of time F 4,24 = 0.1, P = 0.9830; main effect of group F 1,6 = 0.7, P = 0.4329). For panels (C) to (F): * P < 0.05 compared to baseline. For panels (G) and (H): a, significant interaction; b, significant main effect of time; P < 0.05 compared to moderate hypoxia at the same time point. Values are the mean ± SEM (severe, n = 4; moderate, n = 5). [Color figure can be viewed at http://wileyonlinelibrary.com]
Figure 7
Figure 7. Physiological responses of heart rate during baseline, severe or moderate moderate hypoxia and 72 h of normoxic recovery
Hourly averages for severe (A) and moderate (B) hypoxia experiments. Average heart rate recorded following baseline, severe hypoxia, 24 h post‐hypoxia, 48 h post‐hypoxia and 72 h post‐hypoxia during lights on (C) (χ2 = 91.8, d.f. = 4, P < 0.0001) and lights off (D) (F 4,276 = 78.2, P < 0.0001). Average heart rate recorded following normoxia, moderate hypoxia, 24 h post‐hypoxia, 48 h post‐hypoxia and 72 h post‐hypoxia during lights on (E) (χ2 = 98.4, d.f. = 4, P < 0.0001) and lights off (F) (χ2 = 24.7, d.f. = 4, P < 0.0001). Two‐way ANOVA of heart rate during lights on (G) (interaction F 4,52 = 19.7, P < 0.0001; main effect of time F 4,52 = 5.0, P = 0.0018; main effect of group F 1,13 = 10.9, P = 0.0057) and lights off (H) (interaction F 4,52 = 11.8, P < 0.0001; main effect of time F 4,52 = 5.9, P = 0.0005; main effect of group F 1,13 = 13.7, P = 0.0026). For panels (C) to (F): * P < 0.05 compared to baseline. For panels (G) and (H): a, significant interaction; b, significant main effect of time; c, significant main effect of group; P < 0.05 compared to moderate hypoxia at the same time point. Values are the mean ± SEM (severe, n = 7; moderate, n = 8). Note: y‐axes for (A) and (B) are broader than (C) to (H) for visual clarity. [Color figure can be viewed at http://wileyonlinelibrary.com]
Figure 8
Figure 8. Effects of moderate or severe hypoxia on heart rate variability
Mean ± SD R–R interval of normal R–R intervals (SDNN) at baseline and 72 h post severe and moderate hypoxia (A) (interaction F 1,12 = 0.1, P = 0.7543; main effect of time F 1,12 = 14.3, P = 0.0026; main effect of group F 1,12 = 1.6, P = 0.2352). LF spectral power (B) (interaction F 1,12 = 18.5, P = 0.0010; main effect of time F 1,12 = 1.5, P = 0.2500; main effect of group F 1,12 = 4.7, P = 0.0515); HF spectral power (C) (interaction F 1,12 = 26.2, P = 0.0003; main effect of time F 1,12 = 3.9, P = 0.0723; main effect of group F 1,12 = 6.4, P = 0.0266); and the ratio of LF/HF (D) (t 6 = 3.0, P = 0.0110) at baseline and 72 h post severe or moderate hypoxia. * P < 0.05 compared to baseline. P < 0.05 compared to moderate hypoxia. a, significant interaction; b, significant main effect of time; c, significant main effect of group. Values are the mean ± SD (n = 7 per group). [Correction made on 4 July 2018 after first online publication: y‐axis label in D corrected from “LF/HF (Fold change)” to “LF/HF (% change)”.]
Figure 9
Figure 9. Effect of moderate or severe hypoxia on the expression of HIF targets in mesenteric resistance arteries
Mesenteric artery gene expression of erythropoietin (EPO) (A) (interaction F 1,15 = 0.3, P = 0.3227; main effect of time F 1,15 = 1.1, P = 0.3085; main effect of group F 1,15 = 0.2, P = 0.6631) and haeme oxygenase 1 (HMOX1) (B) (interaction F 1,20 = 0.6, P = 0.4327; main effect of time F 1,15 = 20.2, P = 0.0002; main effect of group F 1,15 = 0.4, P = 0.5102) during baseline and following 24 h of severe or moderate hypoxia (n = 4–8 per group). b, significant main effect of time. HMOX1 protein levels 72 h post severe and moderate hypoxia (C) (severe U = 0.0, P = 0.0119; moderate U = 6.0, P = 0.0325; n = 6 for normoxia and moderate, n = 3 for severe; where two animals were required per sample). * P < 0.05 compared to normoxia. Values are the mean ± SD. Representative MemCode total protein stain (D) and HMOX1 immunoblot (E). [Color figure can be viewed at http://wileyonlinelibrary.com]

Similar articles

Cited by

References

    1. Allwood MA, Kinobe RT, Ballantyne L, Romanova N, Melo LG, Ward CA, Brunt KR & Simpson JA (2014). Heme oxygenase‐1 overexpression exacerbates heart failure with aging and pressure overload but is protective against isoproterenol‐induced cardiomyopathy in mice. Cardiovasc Pathol 23, 231–237. - PubMed
    1. Bruno RM, Cogo A, Ghiadoni L, Duo E, Pomidori L, Sharma R, Thapa GB, Basnyat B, Bartesaghi M, Picano E, Sicari R, Taddei S & Pratali L (2014). Cardiovascular function in healthy Himalayan high‐altitude dwellers. Atherosclerosis 236, 47–53. - PubMed
    1. Brunt KR, Tsuji MR, Lai JH, Kinobe RT, Durante W, Claycomb WC, Ward CA & Melo LG (2009). Heme oxygenase‐1 inhibits pro‐oxidant induced hypertrophy in HL‐1 cardiomyocytes. Exp Biol Med (Maywood) 234, 582–594. - PMC - PubMed
    1. Calbet JAL (2003). Chronic hypoxia increases blood pressure and noradrenaline spillover in healthy humans. J Physiol 551, 379–386. - PMC - PubMed
    1. Campen MJ, Shimoda LA & O'Donnell CP (2005). Acute and chronic cardiovascular effects of intermittent hypoxia in C57BL/6J mice. J Appl Physiol 99, 2028–2035. - PubMed

Publication types

LinkOut - more resources