

Localization of adventitious respiratory sounds
- PMID: 29604685
- PMCID: PMC5834319
- DOI: 10.1121/1.5025842
Localization of adventitious respiratory sounds
Abstract
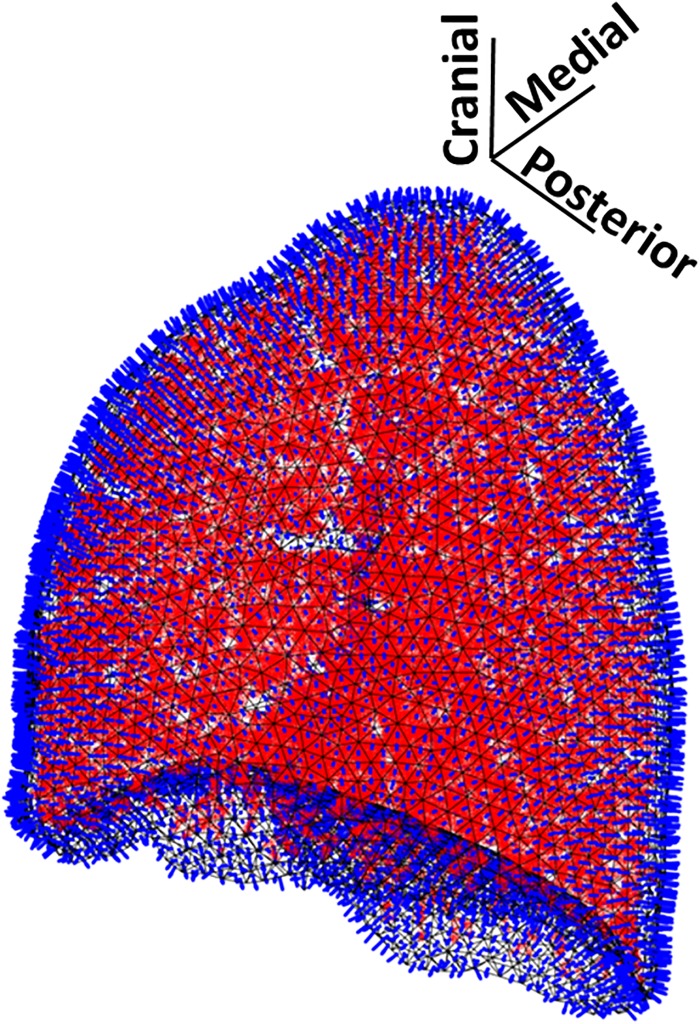
In a recent publication by Henry and Royston [J. Acoust. Soc. Am. 142, 1774-1783 (2017)], an algorithm was introduced to calculate the acoustic response to externally introduced and endogenous respiratory sounds within a realistic, patient-specific subglottal airway tree. This work is extended using an efficient numerical boundary element (BE) approach to calculate the resulting radiated sound field from the airway tree into the lung parenchyma taking into account the surrounding chest wall. Within the BE model of the left lung parenchyma, comprised of more than 6000 triangular surface elements, more than 30 000 monopoles are used to approximate complex airway-originated acoustic sources. The chest wall is modeled as a boundary condition on the parenchymal surface. Several cases were simulated, including a bronchoconstricted lung that had an internal acoustic source introduced in a bronchiole, approximating a wheeze. An acoustic source localization algorithm coupled to the BE model estimated the wheeze source location to within a few millimeters based solely on the acoustic field at the surface. Improved noninvasive means of locating adventitious respiratory sounds may enhance an understanding of acoustic changes correlated to pathology, and potentially provide improved noninvasive tools for the diagnosis of pulmonary diseases that uniquely alter acoustics.
Figures


Similar articles
-
Acoustic Methods for Pulmonary Diagnosis.IEEE Rev Biomed Eng. 2019;12:221-239. doi: 10.1109/RBME.2018.2874353. Epub 2018 Oct 29. IEEE Rev Biomed Eng. 2019. PMID: 30371387 Free PMC article. Review.
-
Acoustic mapping of the lung based on source localization of adventitious respiratory sound components.Annu Int Conf IEEE Eng Med Biol Soc. 2010;2010:3670-3. doi: 10.1109/IEMBS.2010.5627651. Annu Int Conf IEEE Eng Med Biol Soc. 2010. PMID: 21097045
-
Autoregressive modeling of lung sounds: characterization of source and transmission.IEEE Trans Biomed Eng. 1989 Nov;36(11):1133-7. doi: 10.1109/10.40821. IEEE Trans Biomed Eng. 1989. PMID: 2807322
-
Boundary element model for simulating sound propagation and source localization within the lungs.J Acoust Soc Am. 2007 Jul;122(1):657-61. doi: 10.1121/1.2715453. J Acoust Soc Am. 2007. PMID: 17614522
-
[Normal and Adventitious Breath Sounds].Pneumologie. 2016 Jun;70(6):397-404. doi: 10.1055/s-0042-106155. Epub 2016 May 13. Pneumologie. 2016. PMID: 27177168 Review. German.
Cited by
-
Acoustic Methods for Pulmonary Diagnosis.IEEE Rev Biomed Eng. 2019;12:221-239. doi: 10.1109/RBME.2018.2874353. Epub 2018 Oct 29. IEEE Rev Biomed Eng. 2019. PMID: 30371387 Free PMC article. Review.
-
Locating stridor caused by tumor compression by using a multichannel electronic stethoscope: a case report.J Clin Monit Comput. 2021 May;35(3):663-670. doi: 10.1007/s10877-020-00517-8. Epub 2020 May 9. J Clin Monit Comput. 2021. PMID: 32388652 Free PMC article.
-
Simulation of bronchial airway acoustics in healthy and asthmatic subjects.PLoS One. 2020 Feb 10;15(2):e0228603. doi: 10.1371/journal.pone.0228603. eCollection 2020. PLoS One. 2020. PMID: 32040483 Free PMC article.
References
Publication types
MeSH terms
Grants and funding
LinkOut - more resources
Full Text Sources
Other Literature Sources