. 2018 Mar 28;148(12):123304.
doi: 10.1063/1.5000742.

48-spot single-molecule FRET setup with periodic acceptor excitation

Affiliations

48-spot single-molecule FRET setup with periodic acceptor excitation

Antonino Ingargiola et al. J Chem Phys. .

Abstract

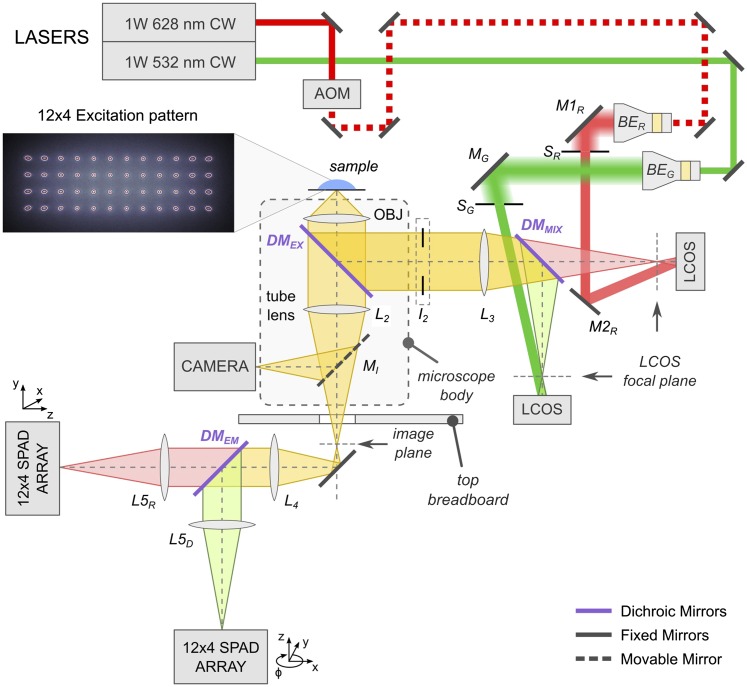
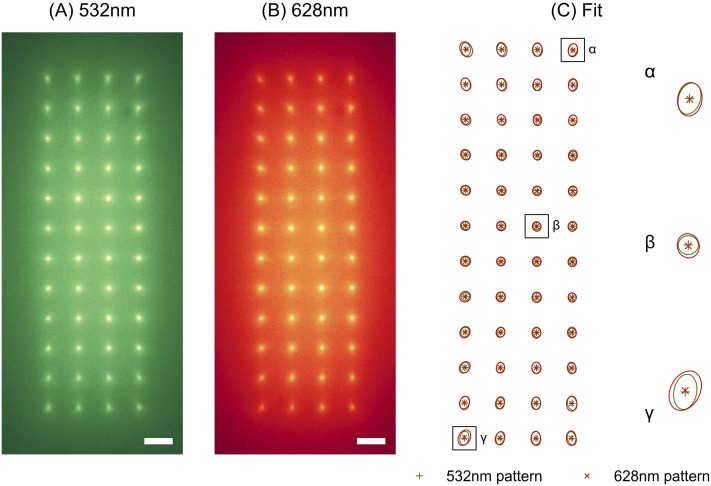
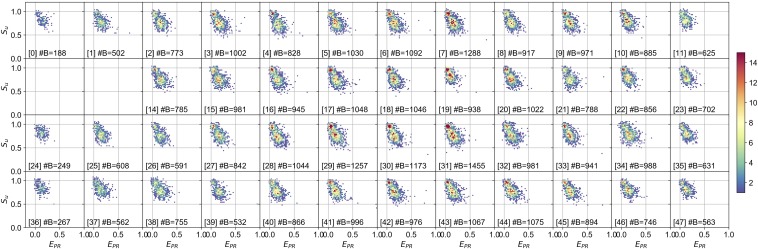
Single-molecule Förster resonance energy transfer (smFRET) allows measuring distances between donor and acceptor fluorophores on the 3-10 nm range. Solution-based smFRET allows measurement of binding-unbinding events or conformational changes of dye-labeled biomolecules without ensemble averaging and free from surface perturbations. When employing dual (or multi) laser excitation, smFRET allows resolving the number of fluorescent labels on each molecule, greatly enhancing the ability to study heterogeneous samples. A major drawback to solution-based smFRET is the low throughput, which renders repetitive measurements expensive and hinders the ability to study kinetic phenomena in real-time. Here we demonstrate a high-throughput smFRET system that multiplexes acquisition by using 48 excitation spots and two 48-pixel single-photon avalanche diode array detectors. The system employs two excitation lasers allowing separation of species with one or two active fluorophores. The performance of the system is demonstrated on a set of doubly labeled double-stranded DNA oligonucleotides with different distances between donor and acceptor dyes along the DNA duplex. We show that the acquisition time for accurate subpopulation identification is reduced from several minutes to seconds, opening the way to high-throughput screening applications and real-time kinetics studies of enzymatic reactions such as DNA transcription by bacterial RNA polymerase.


Figures

FIG. 1.
FIG. 1.
Schematic of the 48-spot PAX setup. The lasers and detectors are on the main optical table, while the microscope (enclosed in the dashed box), beam expanders, and LCOS-SLMs are located on a raised breadboard. See main text and Appendix A for a detailed description.
FIG. 2.
FIG. 2.
Heatmaps of DCRs for the 12 × 4 D- and A-SPAD arrays used in the 48-spot PAX setup. DCR values in counts per second (cps) are indicated in each pixel. More details and data can be found in the accompanying DCR analysis notebook.
FIG. 3.
FIG. 3.
The 12 × 4 multispot pattern for green (a) and red (b) excitation and Gaussian fit of the spots (c). The pattern is acquired by a camera mounted on the microscope side port (see Fig. 1) using a solution of ATTO550 and ATTO647N dyes at high concentration (100 nM). Fluorescent images obtained upon 532 nm or 628 nm laser excitation were acquired separately and are reported in green and red intensity levels in panels (a) and (b), respectively. Scale bars are 5 μm. To assess the alignment, each spot in the two images is fitted with a 2D Gaussian function. Panel (c) reports an overlay of the fitted peak positions and a contour of the Gaussian waist for 532 nm (green) and 628 nm (red) images. A closer look of 3 representative spots is reported on the right. The elliptical shape and tilt of the Gaussian are due to geometrical aberrations. More details can be found in the accompanying alignment notebook.
FIG. 4.
FIG. 4.
Peak burst photon rates in each of the 48 spots for a dsDNA sample with a 12 bp D-A separation. The output laser powers measured before any optics were set to 200 mW and 400 mW for the D- and A-laser, respectively. (a) Full distribution of peak photon rates. (b)-(e) Mean of the peak photon rate distribution in different photon streams. Two lateral spots in the second row exhibit no signal because of two malfunctioning pixels in the D-SPAD array. Colors correspond to different photon streams. Green: DexDem, red: DexAem, light blue: DAexDem, purple: DAexAem. See Appendix D for ALEX and PAX streams definitions. For more details, see the accompanying 48-spot PAX analysis notebook.
FIG. 5.
FIG. 5.
Distribution of peak photon rates in a single-spot μsALEX measurement of the same dsDNA with a 12 bp D-A separation used in 48-spot measurements (Fig. 4). Average laser powers entering the microscope after AOM alternation were 190 μW and 80 μW. Colors correspond to different photon streams. Green: DexDem, red: DexAem, purple: AexAem. See Appendix D for ALEX and PAX streams definitions. For more details, see the accompanying single-spot ALEX analysis notebook.
FIG. 6.
FIG. 6.
EPR versus Su histograms in the different spots for the dsDNA sample with a 12 bp D-A separation. Two subpopulations are visible: D-only (approximately EPR = 0, Su = 1) and FRET population (approximately EPR = 0.6, Su = 0.6). Burst search was performed using all photons with a constant threshold (50 kcps). Burst selection was performed on the total burst size after background correction, using a threshold of 40 photons. The legend in each subplot reports the spot number in brackets and number of bursts (#B). For more details, see the accompanying 48-spot PAX analysis notebook.
FIG. 7.
FIG. 7.
EPR versus Su histograms in the different spots for the dsDNA sample with a 12 bp D-A separation. Data analysis and burst search are identical to Fig. 6, while burst selection is tailored to select only the FRET population: a burst is selected if the number of counts in the DexAem and DAexAem streams is both larger than 20. The legend in each subplot reports the spot number in brackets and number of bursts (#B). For more details, see the accompanying 48-spot PAX analysis notebook.
FIG. 8.
FIG. 8.
Scatter plot of the fitted EPR, Su peak position in the different spots for the D-only (orange cross) and FRET populations (blue plus). Values were obtained by Gaussian fit of the 1-D histogram of EPR and Su after a bursts selection that isolated D-only and FRET populations, respectively. For more details, see the accompanying 48-spot PAX analysis notebook.
FIG. 9.
FIG. 9.
Fitted FRET peak position (EPR, Su, blue dots) and ±1σ of the fitted Gaussian (blue error bars) for the 46 active spots. As a reference, the mean EPR, Su across all 46 spots (orange dots) is reported in each subplot. The spot number is indicated in the top right corner of each subplot. For more details, see the accompanying 48-spot PAX analysis notebook.
FIG. 10.
FIG. 10.
48-spot PAX measurement of a mixture of two dsDNA constructs with 12 and 22 bp D-A separation (sample details in Sec. III A). Burst search was performed on all channels using a constant-rate threshold of 50 kcps. Bursts were selected based on their total size with the criterion Λγ,PAX>80, using γ = 0.5 [see Eq. (D14)]. The E-S histogram was built by pooling data from all spots, without spot-specific correction. For more details, see the accompanying notebook for the 48-spot PAX analysis of the 12 and 22 bp mixture.
FIG. 11.
FIG. 11.
48-spot PAX E-S histograms of the same measurement of Fig. 10. Additional filtering of the D-only population was performed using the criterion FDexDAem>25 (see Appendix D). The E-S histogram was built by pooling data from all spots without spot-specific correction. For more details, see the accompanying notebook for the 48-spot PAX analysis of the 12 and 22 bp mixture.
FIG. 12.
FIG. 12.
Multispot E-S histogram obtained from 5 s of acquisition by pooling bursts from the 46 active spots. For more details, see the accompanying notebook for comparison of a single-spot to 48-spots.
FIG. 13.
FIG. 13.
Single-spot E-S histogram obtained from 5 s of acquisition for the same sample as in Fig. 12. For more details, see the accompanying notebook for comparison of a single-spot to 48-spots.
FIG. 14.
FIG. 14.
Experimental SPAD pixel coordinates after fine alignment for the D-SPAD and A-SPAD arrays obtained with scans of the green LCOS-SLM. D-SPADs center positions are denoted by “X” and A-SPADs center positions are denoted by “+.” The mean distance between D- and A-SPAD pixels is 2.3 μm. For details, see the accompanying SPAD alignment notebook.
FIG. 15.
FIG. 15.
EPR versus Su histograms of all spots for the 22d dsDNA sample. Data analysis and burst search are identical as in Fig. 6. Burst search was performed using all photons with constant threshold (50 kcps). Burst selection was performed on the total burst size after background correction, using a threshold of 40 photons. The legend in each subplot reports the spot number in brackets and number of bursts (#B). For more details, see the accompanying 48-spot PAX analysis notebook.

Similar articles

Cited by

References

    1. Dahan M., Deniz A. A., Ha T., Chemla D. S., Schultz P. G., and Weiss S., Chem. Phys. 247, 85 (1999).10.1016/s0301-0104(99)00132-9 - DOI
    1. Chakraborty A., Wang D., Ebright Y. W., Korlann Y., Kortkhonjia E., Kim T., Chowdhury S., Wigneshweraraj S., Irschik H., Jansen R., Nixon B. T., Knight J., Weiss S., and Ebright R. H., Science 337, 591 (2012).10.1126/science.1218716 - DOI - PMC - PubMed
    1. Kapanidis A. N., Margeat E., Ho S. O., Kortkhonjia E., Weiss S., and Ebright R. H., Science 314, 1144 (2006).10.1126/science.1131399 - DOI - PMC - PubMed
    1. Kapanidis A. N., Margeat E., Laurence T. A., Doose S., Ho S. O., Mukhopadhyay J., Kortkhonjia E., Mekler V., Ebright R. H., and Weiss S., Mol. Cell 20, 347 (2005).10.1016/j.molcel.2005.10.012 - DOI - PubMed
    1. Ha T., Ting A. Y., Liang J., Caldwell W. B., Deniz A. A., Chemla D. S., Schultz P. G., and Weiss S., Proc. Natl. Acad. Sci. U. S. A. 96, 893 (1999).10.1073/pnas.96.3.893 - DOI - PMC - PubMed