. 2018 Jun;93(6):1367-1383.
doi: 10.1016/j.kint.2017.12.017. Epub 2018 Mar 28.

Activated renal tubular Wnt/β-catenin signaling triggers renal inflammation during overload proteinuria

Affiliations

Activated renal tubular Wnt/β-catenin signaling triggers renal inflammation during overload proteinuria

Dickson W L Wong et al. Kidney Int. 2018 Jun.

Abstract

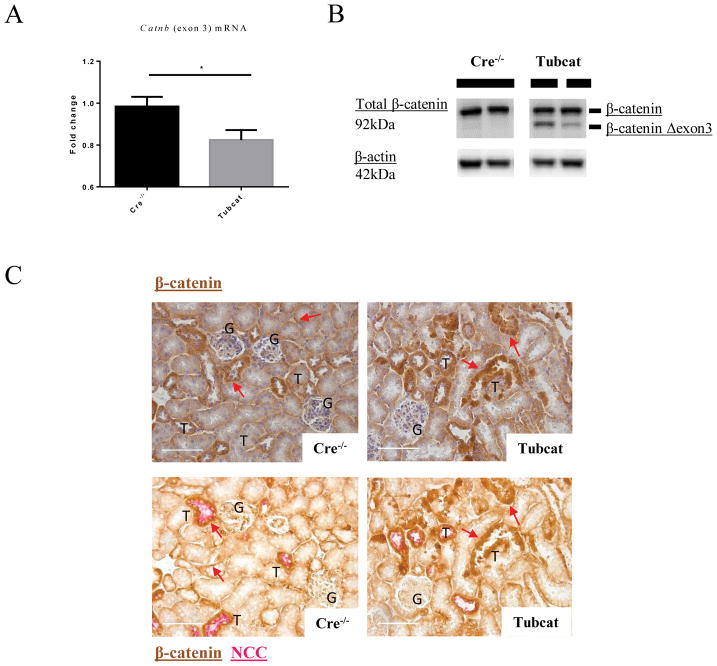
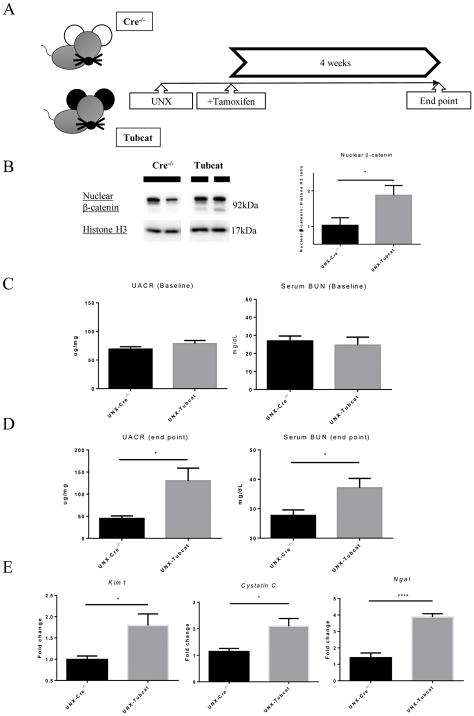
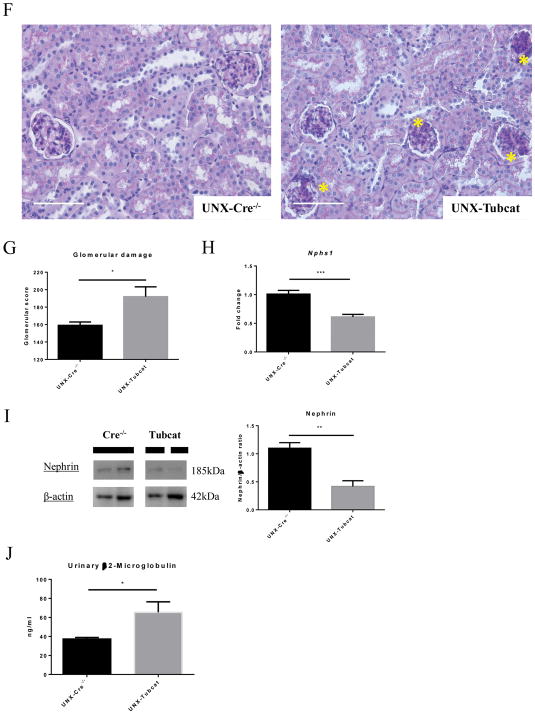
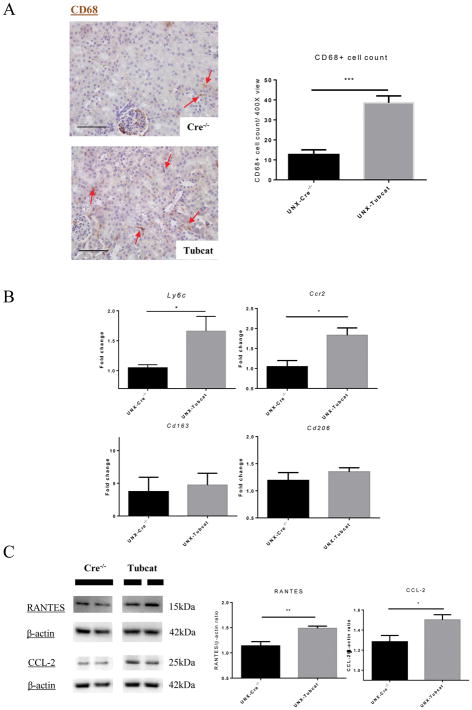
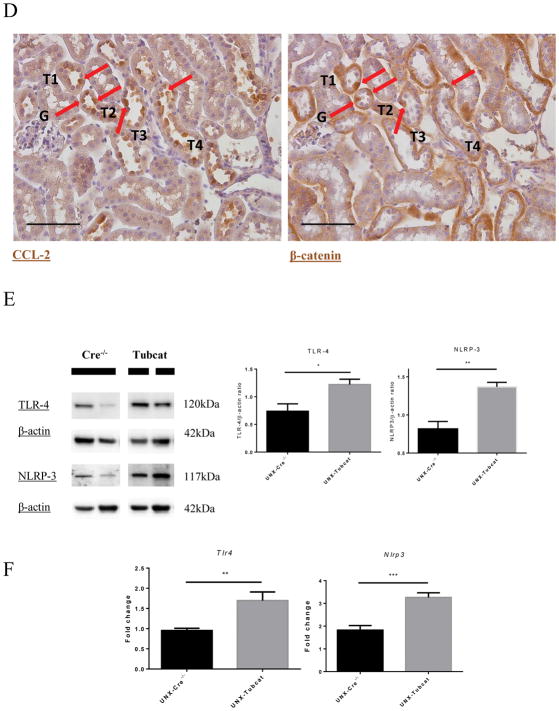
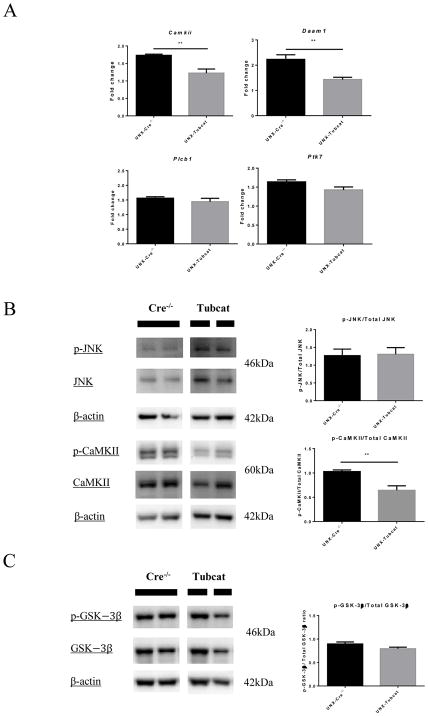
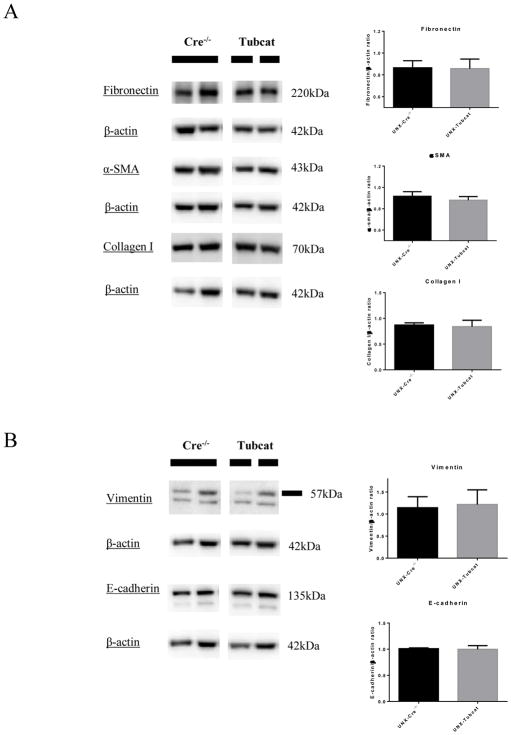
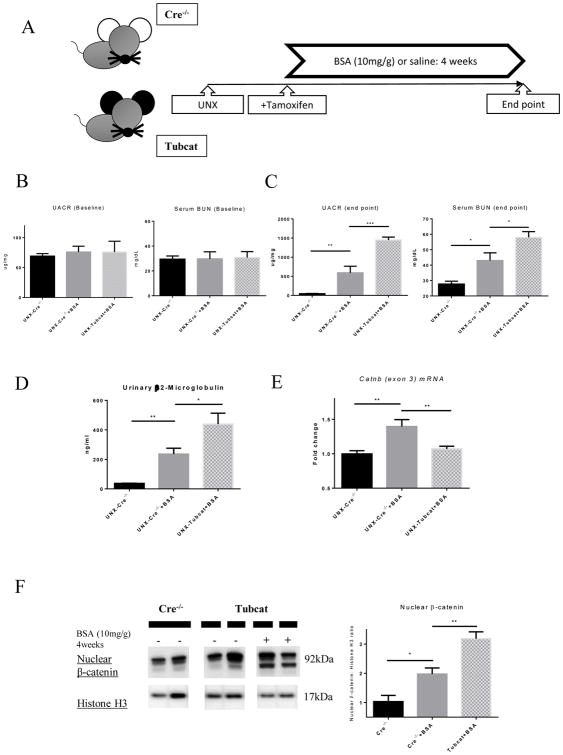
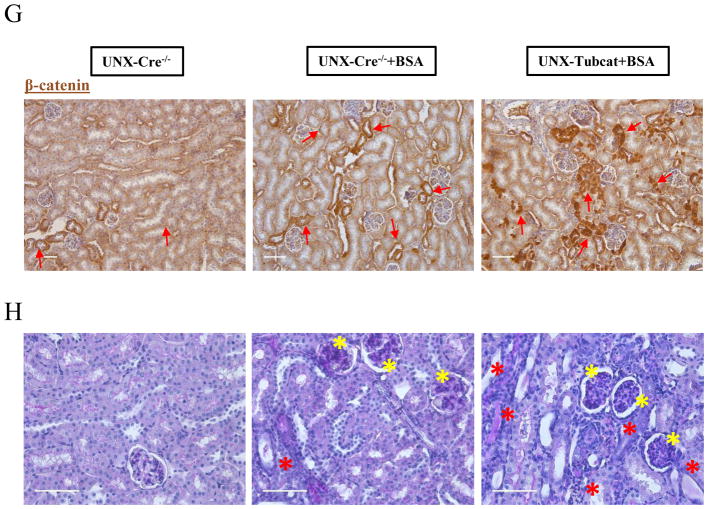
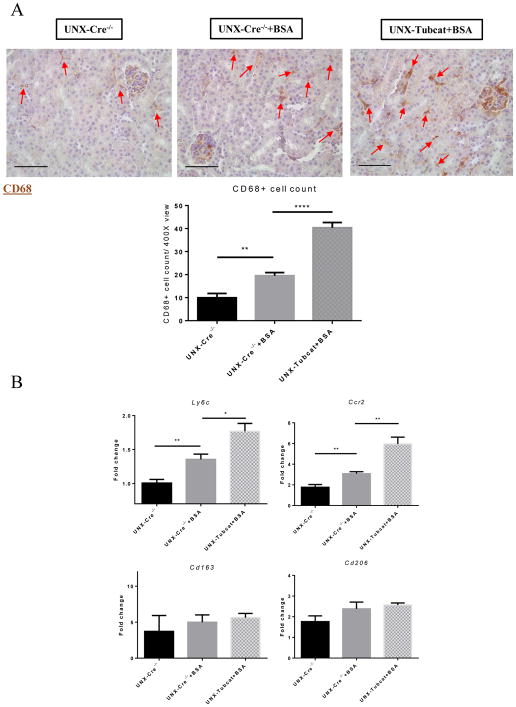
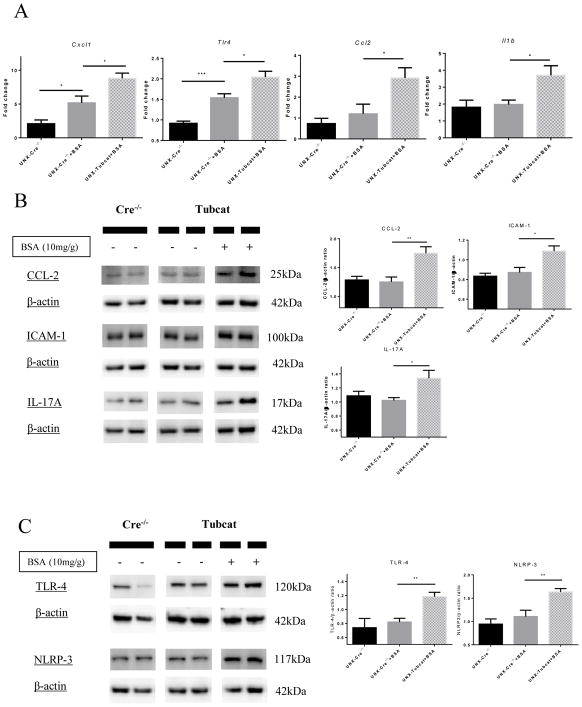
Imbalance of Wnt/β-catenin signaling in renal cells is associated with renal dysfunction, yet the precise mechanism is poorly understood. Previously we observed activated Wnt/β-catenin signaling in renal tubules during proteinuric nephropathy with an unknown net effect. Therefore, to identify the definitive role of tubular Wnt/β-catenin, we generated a novel transgenic "Tubcat" mouse conditionally expressing stabilized β-catenin specifically in renal tubules following tamoxifen administration. Four weeks after tamoxifen injection, uninephrectomized Tubcat mice displayed proteinuria and elevated blood urea nitrogen levels compared to non-transgenic mice, implying a detrimental effect of the activated signaling. This was associated with infiltration of the tubulointerstitium predominantly by M1 macrophages and overexpression of the inflammatory chemocytokines CCL-2 and RANTES. Induction of overload proteinuria by intraperitoneal injection of low-endotoxin bovine serum albumin following uninephrectomy for four weeks aggravated proteinuria and increased blood urea nitrogen levels to a significantly greater extent in Tubcat mice. Renal dysfunction correlated with the degree of M1 macrophage infiltration in the tubulointerstitium and renal cortical up-regulation of CCL-2, IL-17A, IL-1β, CXCL1, and ICAM-1. There was overexpression of cortical TLR-4 and NLRP-3 in Tubcat mice, independent of bovine serum albumin injection. Finally, there was no fibrosis, activation of epithelial-mesenchymal transition or non-canonical Wnt pathways observed in the kidneys of Tubcat mice. Thus, conditional activation of renal tubular Wnt/β-catenin signaling in a novel transgenic mouse model demonstrates that this pathway enhances intrarenal inflammation via the TLR-4/NLRP-3 inflammasome axis in overload proteinuria.

Keywords: Wnt/β-catenin; proteinuric nephropathy; renal inflammation.


Figures

Figure 1
Figure 1. Tubcat mice overexpress β-catenin specifically in renal tubules after tamoxifen induction
(A) qPCR showed less mRNA expression of Catnb allele (exon 3) in the renal cortex of Tubcat mice after transgenic modification (n=5). (B) Expression of the native and mutant forms of β-catenin in renal cortical cells by immunoblotting. (C) Consecutive kidney sections revealed β-catenin overexpression in the renal tubules of Tubcat mice. Upper panels show the IHC staining of β-catenin (brown) and the lower panels show the co-staining of β-catenin (brown) and Na+-Cl cotransporter (NCC, tubule marker; red). Red arrows indicate tubular β-catenin expression in Cre−/− and Tubcat mice, respectively. Bar scale = 250 μm. Results were expressed as means ± SEM. A two-sided t-test was used for comparison. G, glomerulus. T, renal tubules. M, DNA ladder. *p<0.05
Figure 2
Figure 2. Renal dysfunction in uninephrectomized Tubcat mice 4 weeks after tamoxifen induction
(A) Schema of transgenic induction in Tubcat mice. (B) Expression of nuclear β-catenin in renal cortices of experimental mice (n=5). Representative immunoblots are shown. Urine albumin-to-creatinine ratio (UACR) and blood urea nitrogen (BUN) were measured at (C) baseline (n=5) and (D) 4 weeks after tamoxifen administration (n=5). (E) Renal cortical expression of AKI markers (n=5) in Tubcat and Cre−/− mice at experimental endpoint. (F) Representative periodic acid-Schiff (PAS) staining of kidney section from UNX-Tubcat and UNX-Cre−/− mice. Asterisks indicates the mesangial expansion. Bar scale = 250 μm. (G) Glomerular damage scoring of the kidney sections from the experimental mice (n=5). (H) Gene expression of Nphs1 in renal cortices of uninephrectomized Tubcat and Cre−/− mice (n=5) 4 weeks after tamoxifen administration by qPCR. (I) Renal cortical protein expression of nephrin in the experimental mice (n=5) by immunoblotting assay. (J) Urinary β2-macroglobulin was measured in experimental mice 4 weeks after tamoxifen administration (n=5). Results were expressed as means ± SEM. A two-sided t-test was used for comparison. *p<0.05, **p< 0.01, ***p<0.0001
Figure 3
Figure 3. Renal inflammation in uninephrectomized Tubcat mice with enhanced cortical chemocytokine expression
(A) Immunohistochemical staining of CD68+ cells (red arrows) on kidney tissues. Average CD68+ cell counts on tubulointerstitial area (400X magnification) of Tubcat and Cre−/− mice (n=5). (B) Gene expression of M1 (Ly6c and Ccr2) and M2 (Cd163 and Cd206) macrophage markers in renal cortices of Tubcat and Cre−/− mice (n=5) 4 weeks after tamoxifen administration by qPCR. Renal cortical expression of (C) RANTES, CCL-2, and (E) TLR-4 and NLRP-3 in experimental mice by immunoblottings (n=5). (D) Immunohistochemistry staining of CCL-2 and β-catenin on serial kidney sections from a Tubcat mouse by using different primary antibodies as annotated. Red arrows indicate the colocalization of CCL-2 and β-catenin detected in the same tubular cells. Bar scale = 250 μm. (F) Gene expression of TLR-4 and NLRP-3 by qPCR (n=5). Results were expressed as means ± SEM. A two-sided t-test was used for comparison. *p<0.05, **p< 0.01, ***p<0.0001
Figure 4
Figure 4. Expression of non-canonical Wnt pathway regulators in uninephrectomized Tubcat mice for 4 weeks
(A) Expression of non-canonical Wnt signaling related genes in renal cortices of uninephrectomized Tubcat and non-transgenic mice (n=5) by qPCR. Phosphorylation level of (B) JNK, CaMKII and (C) GSK-3β in renal cortices of uninephrectomized Tubcat and non-transgenic mice (n=5) by immunoblotting assay. Results were expressed as means ± SEM. A two-sided t-test was used for comparison. **p< 0.01
Figure 5
Figure 5. Fibrosis and EMT markers in UNX-Tubcat mice for 4 weeks
(A) Expression of fibrotic markers (fibronectin, α-SMA and collagen I) in renal cortices of UNX-Tubcat and UNX-Cre−/− mice (n=5) by immunoblotting assay. (B) Renal cortical expression of EMT markers (vimentin and E-cadherin) of uninephrectomized Tubcat and non-transgenic mice (n=5) by immunoblotting assay. Results were expressed as means ± SEM.
Figure 6
Figure 6. Induction of protein overload in uninephrectomized Tubcat and Cre−/− mice for 4 weeks
(A) Schema of UNX-Tubcat mice in protein overload model. UACR and BUN levels of experimental mice at (B) baseline (n=5) and (C) 4 weeks after BSA injection (n=5). (D) Urinary β2-macroglobulin measured in BSA injected UNX-Cre−/− mice and UNX-Tubcat mice at the experimental endpoint (n=5). (E) Renal cortical mRNA expression from Catnb allele (exon 3) by qPCR (n=5). (F) Both mutant and wild-type forms of nuclear β-catenin expression in the renal cortical lysate by immunoblotting (n=5). (G) Immunohistochemical staining of β-catenin on kidney tissues. Red arrows indicate β-catenin expression in tubules. Bar scale = 125 μm. (H) Representative periodic acid-Schiff (PAS) staining of kidney section from BSA injected UNX-Tubcat and UNX-Cre−/− mice. Yellow asterisks indicate the mesangial expansion and red asterisks indicate tubular injury. Bar scale = 250 μm. A One-way ANOVA was used for comparison. Results were expressed as means ± SEM. *p<0.05, **p< 0.01, ***p<0.0001
Figure 7
Figure 7. Increased tubulointerstitial macrophage infiltration in protein overloaded Tubcat mice
(A) CD68+ cells (red arrows) in kidney sections of protein overloaded animals and quantification (n=5). (B) Renal cortical expression of M1 and M2 macrophage markers in Tubcat and Cre−/− mice (n=5) by qPCR. Bar scale = 250 μm. Results were expressed as means ± SEM. A One-way ANOVA was used for comparison. *p<0.05, **p< 0.01, ****p<0.0001
Figure 8
Figure 8. Induction of inflammatory chemocytokines and TLR-4/NLRP-3 in BSA-injected Tubcat mice
(A) Cortical gene expression of inflammatory chemocytokines (Cxcl1, Tlr4, Ccl2 and IL1b) in BSA-injected mice by qPCR (n=5). Protein levels of (B) CCl-2, ICAM-1, IL-17A and (C) TLR-4 and NLRP-3 by immunoblotting of kidney cortical lysates (n=5). Results were expressed as mean ± SEM. A One-way ANOVA was used for comparison. *p<0.05, **p< 0.01, ***p<0.001

Similar articles

Cited by

References

    1. Heerspink HJ, Kropelin TF, Hoekman J, et al. Drug-Induced Reduction in Albuminuria Is Associated with Subsequent Renoprotection: A Meta-Analysis. J Am Soc Nephrol. 2015;26:2055–2064. - PMC - PubMed
    1. Baines RJ, Brunskill NJ. Tubular toxicity of proteinuria. Nat Rev Nephrol. 2011;7:177–180. - PubMed
    1. Li RX, Yiu WH, Tang SC. Role of bone morphogenetic protein-7 in renal fibrosis. Front Physiol. 2015;6:114. - PMC - PubMed
    1. Saito A, Sato H, Iino N, et al. Molecular mechanisms of receptor-mediated endocytosis in the renal proximal tubular epithelium. J Biomed Biotechnol. 2010;2010:403272. - PMC - PubMed
    1. Birn H, Christensen EI. Renal albumin absorption in physiology and pathology. Kidney Int. 2006;69:440–449. - PubMed

Publication types

MeSH terms

LinkOut - more resources