. 2018 Jul:115:39-48.
doi: 10.1016/j.nbd.2018.03.012. Epub 2018 Mar 29.

Translation-relevant EEG phenotypes in a mouse model of Fragile X Syndrome

Affiliations

Translation-relevant EEG phenotypes in a mouse model of Fragile X Syndrome

Jonathan W Lovelace et al. Neurobiol Dis. 2018 Jul.

Abstract

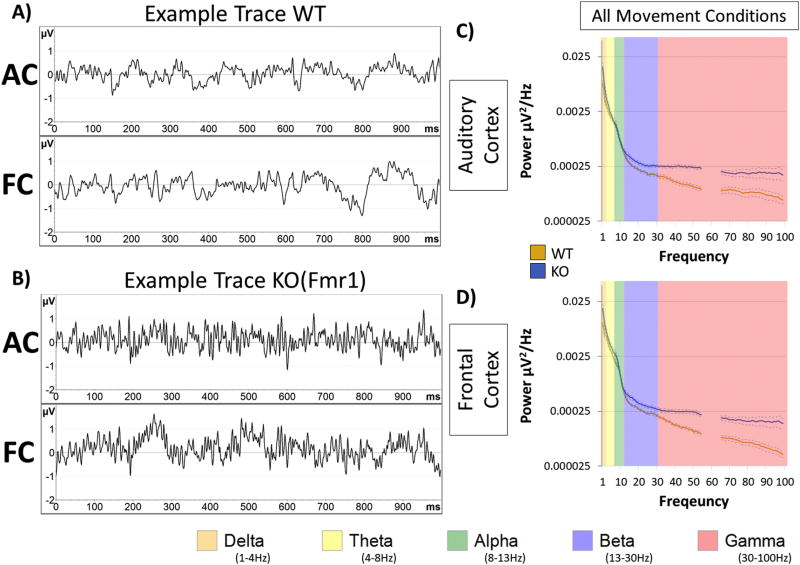
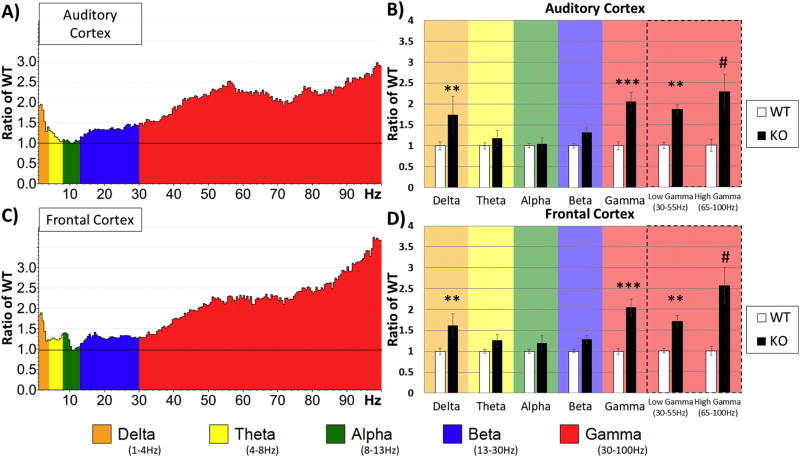
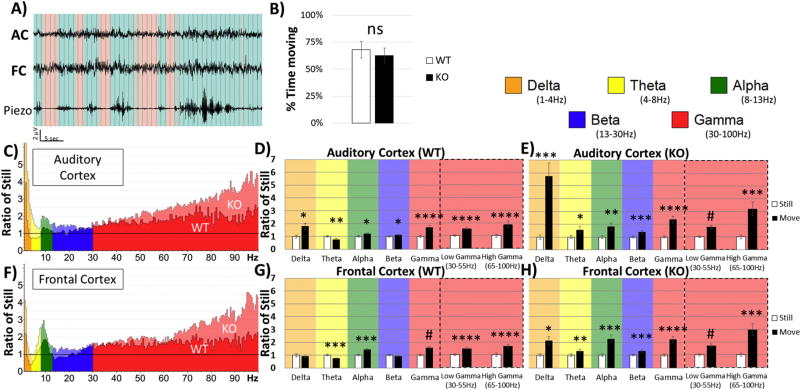
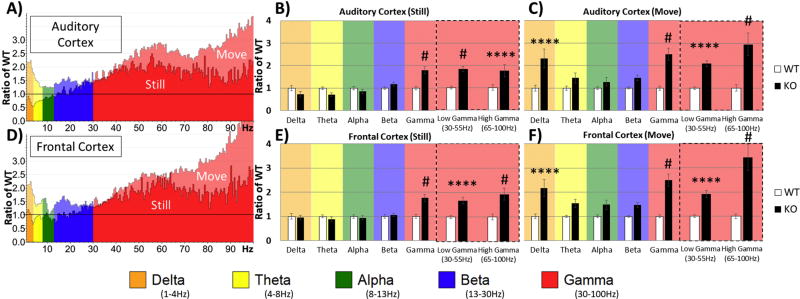
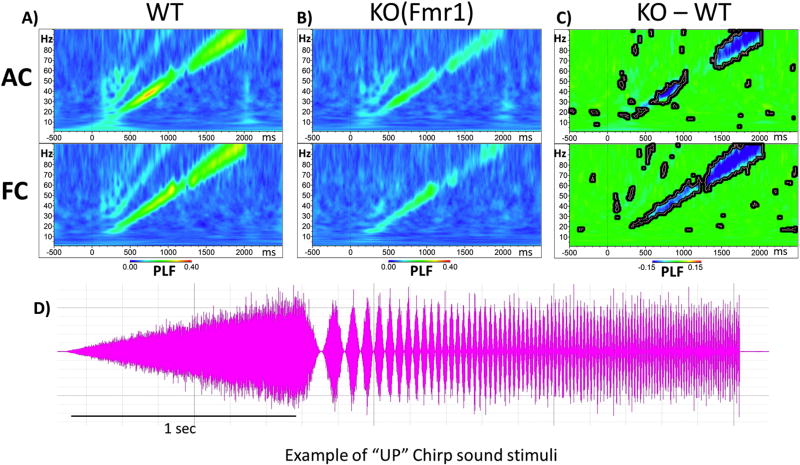
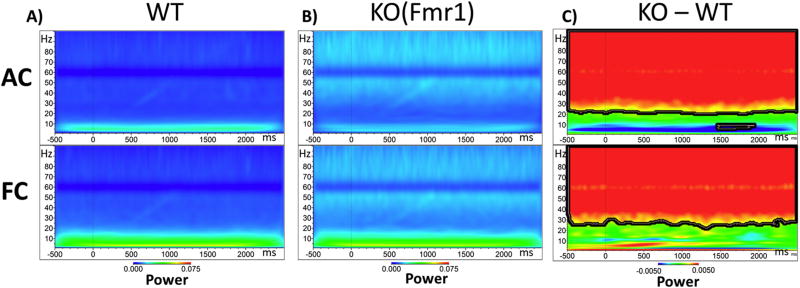
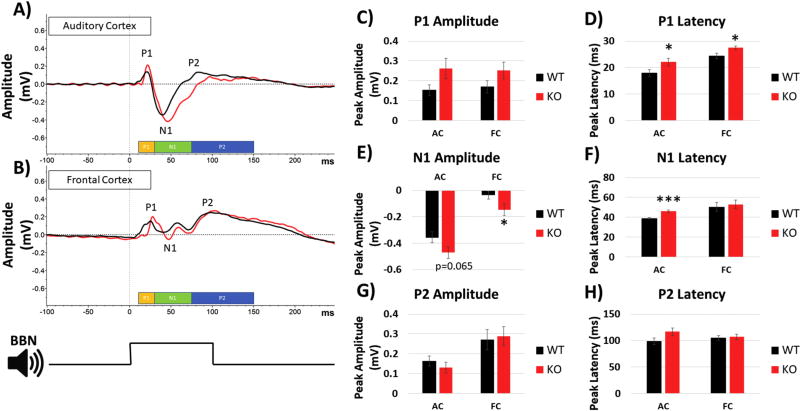
Identification of comparable biomarkers in humans and validated animal models will facilitate pre-clinical to clinical therapeutic pipelines to treat neurodevelopmental disorders. Fragile X Syndrome (FXS) is a leading known genetic cause of intellectual disability with symptoms that include increased anxiety, social and sensory processing deficits. Recent EEG studies in humans with FXS have identified neural oscillation deficits that include enhanced resting state gamma power and reduced inter-trial coherence of sound evoked gamma oscillations. To determine if analogous phenotypes are present in an animal model of FXS, we recorded EEGs in awake, freely moving Fmr1 knock out (KO) mice using similar stimuli as in the human studies. We report remarkably similar neural oscillation phenotypes in the Fmr1 KO mouse including enhanced resting state gamma power and reduced evoked gamma synchronization. The gamma band inter-trial coherence of neural response was reduced in both auditory and frontal cortex of Fmr1 KO mice stimulated with a sound whose envelope was modulated from 1 to 100 Hz, similar to that seen in humans with FXS. These deficits suggest a form of enhanced 'resting state noise' that interferes with the ability of the circuit to mount a synchronized response to sensory input, predicting specific sensory and cognitive deficits in FXS. The abnormal gamma oscillations are consistent with parvalbumin neuron and perineuronal net deficits seen in the Fmr1 KO mouse auditory cortex indicating that the EEG biomarkers are not only clinically relevant, but could also be used to probe cellular and circuit mechanisms of sensory hypersensitivity in FXS.

Keywords: Auditory cortex; Autism; EEG; Fragile X Syndrome; Frontal cortex; Neural oscillations; Sensory hypersensitivity.


Figures

Figure 1
Figure 1. Characterization of gamma power increase in Fmr1 KO mice
Resting data (baseline, in the absence of auditory stimulation) was collected for 5 minutes and was divided into 1 second segments for spectral analysis. Depicted are examples segments from WT (A) and KO (B) which include simultaneous recording from Auditory Cortex (AC) and Frontal Cortex (FC). Power density (µV2/Hz) was calculated for each artifact-free segment using Fast Fourier Transform, followed by averaging all segments for a given animal. These individual averages then contributed to the genotype grand average as seen in the AC (C) and FC (D) for each genotype. Obvious differences between genotype are observed at gamma frequencies (30–100Hz in pink). Note: frequencies from 55–65Hz were excluded in all analysis, as a 60Hz notch filter was utilized to eliminate line noise.
Figure 2
Figure 2. Increased resting state gamma and delta power in F mr1 KO mice
Five minutes of resting (non-stimulus) EEG data from electrodes implanted in the auditory cortex (A, B) and frontal cortex (C, D) of WT and KO animals was recorded and FFT analysis was done to determine spectral power. Average power in the Fmr1 KO mouse auditory cortex (A) and frontal cortex (C) is expressed as the ratio of WT levels. A value of 1 (horizontal black line) indicates no mean difference in power at that frequency between WT and KO while values above the black line indicate KO>WT, and below KO<WT. Auditory (B) and frontal (D) cortex values were divided into standard frequency bands and post-hoc simple effects after two-way ANOVA revealed differences in delta and gamma frequency ranges. The gamma band was further subdivided into low and high gamma revealing genotype differences in both bands. Both cortical regions show significant increase in delta and gamma ranges in Fmr1 KO mice. *p<0.05, **p<0.01, ***p<0.001, ****p<0.0001, #p<0.00001.
Figure 3
Figure 3. Movement affects spectral EEG power in the auditory and frontal Cortex
(A) A Piezo-electric transducer was placed under the floor of the recording chamber while resting EEG was collected. Data were then divided into movement (blue) and still (red) states, based on threshold crossing on the Piezo channel. (B) Total time spent moving or still during the resting (non-stimulus) EEG recordings was calculated for each mouse. No significant differences between WT and KO mice were observed in the time moving. Auditory cortex (C) and frontal cortex (F) values represent power during movement divided by the power while still. This allows for within subject analysis of movement state on power for each group. D) Repeated Measures (still-white and moving-black) separated into frequency bands in AC of WT, E) AC of KO, G) FC of WT, and H) FC of KO. A general increase in power was present during movement in both AC and FC in both genotypes, but as seen in (C) and (F), the increase in Fmr1 KO mice was much larger. *p<0.05, **p<0.01, ***p<0.001, ****p<0.0001, #p<0.00001.
Figure 4
Figure 4. Differences in Power between WT and Fmr1 KO depend on movement state
(A&D) Same data as in Figure 2 (A&C), but further divided by movement state. In both AC and FC, gamma band power was enhanced in Fmr1 KO relative to WT regardless of movement state. However, the delta power increase in Fmr1 KO was seen only when the mice were moving. Quantification of these observations is shown in the plots to the right. (B) When the mice were still, significantly increased gamma power is seen in AC of KO mice. (C) When the mice were moving, both gamma and delta power were increased in KO mice. (E, F) Essentially identical effects of movements on power across various EEG frequencies were also observed in the frontal cortex (FC). *p<0.05, **p<0.01, ***p<0.001, ****p<0.0001, #p<0.00001.
Figure 5
Figure 5. Fmr1 KO mice are deficient in Phase Locking to Auditory “Up Chirp” stimuli
(A, top row) Grand average WT Phase Locking Factor (PLF) to upward chirp in auditory cortex (AC). (A, bottom row) PLF in the frontal cortex (FC). Increased phase locking along the diagonal matches the modulation frequency of the chirp in both AC and FC. (B, top row) Auditory cortex grand average PLF to up chirp in KO mice. (B, bottom row) Grand average PLF in FC of KO mice. It can be seen that in both AC and FC, the PLF values are reduced in KO compared to WT mice. (C, top row) Auditory cortex WT PLF values are subtracted from KO values with blue areas indicating KOWT. Statistical cluster analysis reveals time x frequency bands that are significantly different between groups highlighted by bolded black borders. (D) Example “Up Chirp” auditory stimuli.
Figure 6
Figure 6. Single Trial Power (STP) of Fmr1 KO mice is increased in the Gamma Range during Chirp Stimulation
(A) Grand average WT STP to up chirp in auditory cortex (AC, top row) and frontal cortex (FC, bottom row). This is on-going ‘background’ power during auditory stimulation B) AC (top) and FC (bottom) grand average KO STP to up chirp. C) AC (top) and FC (bottom) STP values from WT are subtracted from KO values. Blue areas indicating KOWT. Statistical cluster analysis reveals time x frequency bands that are significantly different between groups highlighted with bolded black borders.
Figure 7
Figure 7. ERP in response to broadband noise in auditory and frontal cortices
Broad Band Noise (BBN) with 100ms duration was played to mice at a rate of 0.25Hz for 1000 repetitions. (A) Grand average ERPs compiled from all mice in each group from the AC and (B) FC. Peaks were determined by pre-defined time windows displayed at the bottom: P1 (yellow, 10–30ms), N1 (green, 30–75ms), and P2 (blue, 75–150ms). (C) No difference was detected in P1 amplitude, but (D) P1 latency was significantly longer in KO mice in both AC and FC. E) N1 amplitude was significantly larger in the FC of the KO mice with a trend towards increase in AC (p=0.065). (F) N1 latency was significantly longer in AC, but no differences were seen in the FC. (G–H) Neither P2 amplitude nor latencies showed genotype differences in AC or FC. *p<0.05, **p<0.01, ***p<0.001, ****p<0.0001, #p<0.00001.

Similar articles

Cited by

References

    1. Abbeduto L, Hagerman RJ. Language and communication in fragile X syndrome. Developmental Disabilities Research Reviews. 1997;3(4):313–322.
    1. Abbeduto L, Brady N, Kover ST. Language development and fragile X syndrome: Profiles, syndrome- specificity, and within- syndrome differences. Developmental Disabilities Research Reviews. 2007;13(1):36–46. - PMC - PubMed
    1. Bakker CE, Verheij C, Willemsen R, Vanderhelm R, Oerlemans F, Vermey M, Bygrave A, Hoogeveen AT, Oostra BA, Reyniers E, Deboulle K, Dhooge R, Cras P, Vanvelzen D, Nagels G, Martin JJ, Dedeyn PP, Darby JK, Willems PJ. Fmr1 knockout mice - a model to study fragile-x mental-retardation. Cell. 1994;78:23–33. - PubMed
    1. Bernardet M, Crusio WE. Fmr1 KO mice as a possible model of autistic features. The Scientific World Journal. 2006;6:1164–1176. - PMC - PubMed
    1. Berry-Kravis E. Epilepsy in fragile X syndrome. Dev Med Child Neurol. 2002;44:724–728. - PubMed

Publication types

Substances