

Lesion mapping in acute stroke aphasia and its implications for recovery
- PMID: 29605593
- PMCID: PMC6018610
- DOI: 10.1016/j.neuropsychologia.2018.03.036
Lesion mapping in acute stroke aphasia and its implications for recovery
Abstract
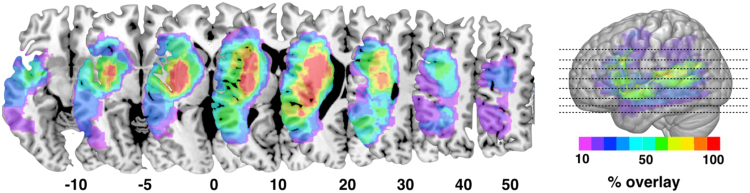
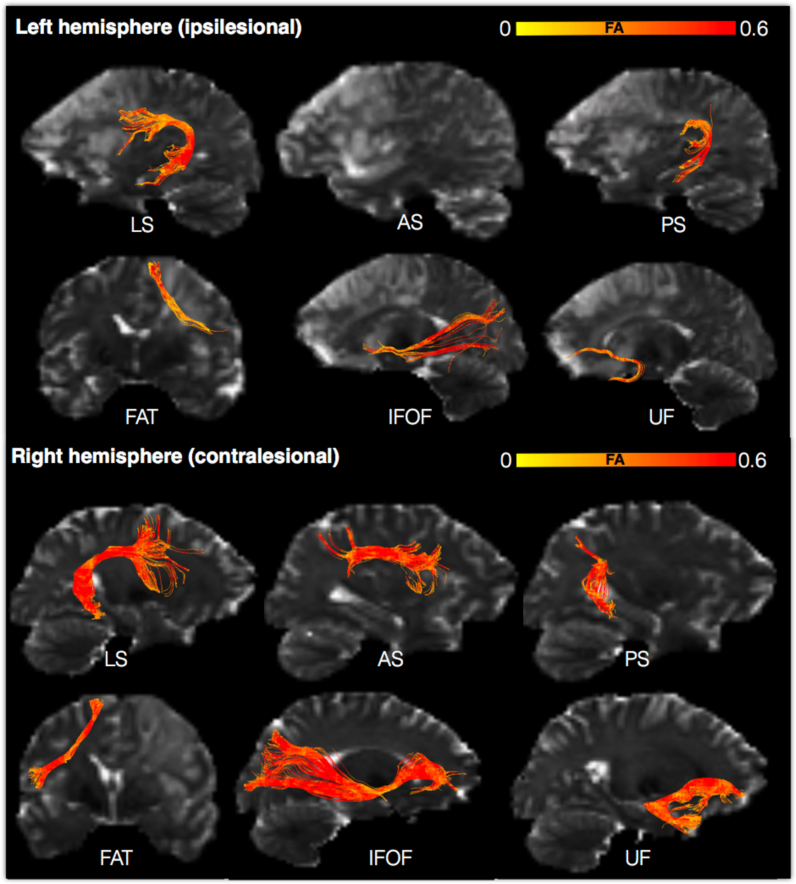
Patients with stroke offer a unique window into understanding human brain function. Mapping stroke lesions poses several challenges due to the complexity of the lesion anatomy and the mechanisms causing local and remote disruption on brain networks. In this prospective longitudinal study, we compare standard and advanced approaches to white matter lesion mapping applied to acute stroke patients with aphasia. Eighteen patients with acute left hemisphere stroke were recruited and scanned within two weeks from symptom onset. Aphasia assessment was performed at baseline and six-month follow-up. Structural and diffusion MRI contrasts indicated an area of maximum overlap in the anterior external/extreme capsule with diffusion images showing a larger overlap extending into posterior perisylvian regions. Anatomical predictors of recovery included damage to ipsilesional tracts (as shown by both structural and diffusion images) and contralesional tracts (as shown by diffusion images only). These findings indicate converging results from structural and diffusion lesion mapping methods but also clear differences between the two approaches in their ability to identify predictors of recovery outside the lesioned regions.
Keywords: Acute stroke; Aphasia recovery; Lesion mapping; Tractography; VLSM; White matter atlas.
Copyright © 2018 The Author(s). Published by Elsevier Ltd.. All rights reserved.
Figures


Similar articles
-
Anatomical predictors of aphasia recovery: a tractography study of bilateral perisylvian language networks.Brain. 2014 Jul;137(Pt 7):2027-39. doi: 10.1093/brain/awu113. Brain. 2014. PMID: 24951631
-
Neural substrates of subcortical aphasia in subacute stroke: Voxel-based lesion symptom mapping study.J Neurol Sci. 2021 Jan 15;420:117266. doi: 10.1016/j.jns.2020.117266. Epub 2020 Dec 9. J Neurol Sci. 2021. PMID: 33341084
-
Neural Basis of Acquired Amusia and Its Recovery after Stroke.J Neurosci. 2016 Aug 24;36(34):8872-81. doi: 10.1523/JNEUROSCI.0709-16.2016. J Neurosci. 2016. PMID: 27559169 Free PMC article.
-
The role of language-related functional brain regions and white matter tracts in network plasticity of post-stroke aphasia.J Neurol. 2024 Jun;271(6):3095-3115. doi: 10.1007/s00415-024-12358-5. Epub 2024 Apr 12. J Neurol. 2024. PMID: 38607432 Review.
-
The use of non-invasive brain stimulation techniques to facilitate recovery from post-stroke aphasia.Neuropsychol Rev. 2011 Sep;21(3):288-301. doi: 10.1007/s11065-011-9181-y. Epub 2011 Aug 14. Neuropsychol Rev. 2011. PMID: 21842404 Free PMC article. Review.
Cited by
-
Post-stroke deficit prediction from lesion and indirect structural and functional disconnection.Brain. 2020 Jul 1;143(7):2173-2188. doi: 10.1093/brain/awaa156. Brain. 2020. PMID: 32572442 Free PMC article.
-
Association of Lesion Location With Long-Term Recovery in Post-stroke Aphasia and Language Deficits.Front Neurol. 2019 Jul 24;10:776. doi: 10.3389/fneur.2019.00776. eCollection 2019. Front Neurol. 2019. PMID: 31396146 Free PMC article.
-
Predictors of Therapy Response in Chronic Aphasia: Building a Foundation for Personalized Aphasia Therapy.J Stroke. 2022 May;24(2):189-206. doi: 10.5853/jos.2022.01102. Epub 2022 May 31. J Stroke. 2022. PMID: 35677975 Free PMC article. Review.
-
Anatomical evidence of an indirect pathway for word repetition.Neurology. 2020 Feb 11;94(6):e594-e606. doi: 10.1212/WNL.0000000000008746. Epub 2020 Jan 29. Neurology. 2020. PMID: 31996450 Free PMC article.
-
Functional Contributions of the Arcuate Fasciculus to Language Processing.Front Hum Neurosci. 2021 Jun 25;15:672665. doi: 10.3389/fnhum.2021.672665. eCollection 2021. Front Hum Neurosci. 2021. PMID: 34248526 Free PMC article.
References
-
- Baldo J.V., Kacinik N.A., Moncrief A., Beghin F., Dronkers N.F. You may now kiss the bride: interpretation of social situations by individuals with right or left hemisphere injury. Neuropsychologia. 2016;9(80):133–141. - PubMed
-
- Bartolomeo P., Thiebaut de Schotten M. Let thy left brain know what thy right brain doeth: inter-hemispheric compensation of functional deficits after brain damage. Neuropsychologia. 2016;93(Pt B):407–412. - PubMed
-
- Basser P.J. In vivo fiber tractography using DT-MRI data. Magn. Reson. Med. 2000;44(4):625–632. - PubMed
-
- Bates E., Wilson S.M., Saygin A.P., Dick F., Sereno M.I., Knight R.T., Dronkers N.F. Voxel-based lesion–symptom mapping. Nat. Neurosci. 2003;6:448–450. - PubMed
Publication types
MeSH terms
Grants and funding
LinkOut - more resources
Full Text Sources
Other Literature Sources
Medical
