. 2018 May;20(5):467-477.
doi: 10.1016/j.neo.2018.02.009. Epub 2018 Mar 30.

Concomitant BCORL1 and BRAF Mutations in Vemurafenib-Resistant Melanoma Cells

Affiliations

Concomitant BCORL1 and BRAF Mutations in Vemurafenib-Resistant Melanoma Cells

Luca Mologni et al. Neoplasia. 2018 May.

Abstract

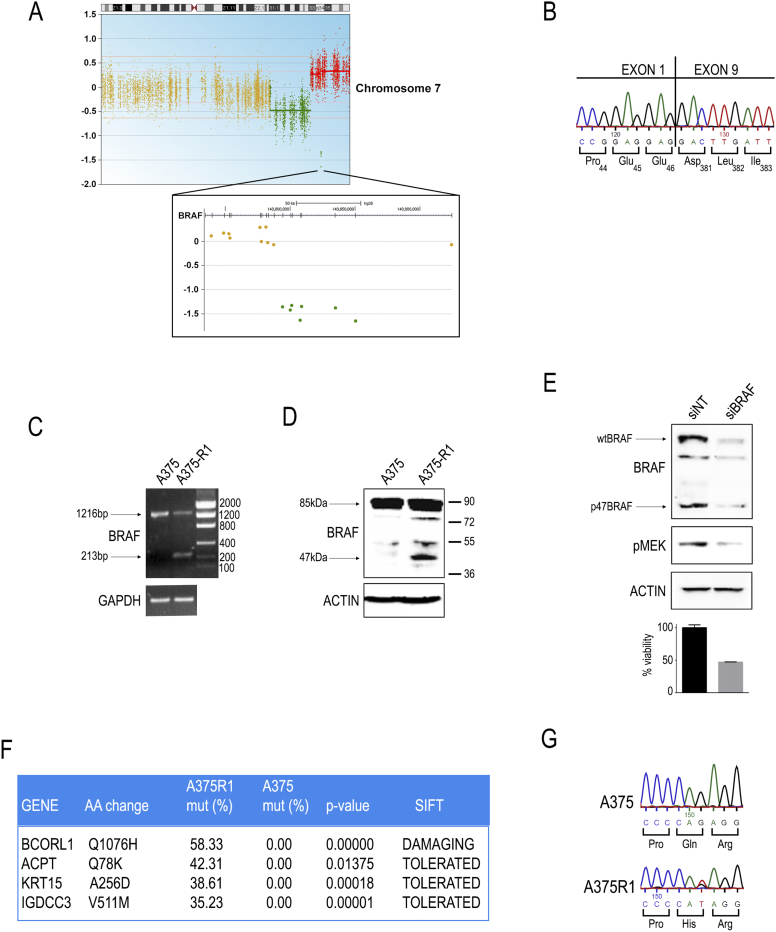
BRAF is the most frequently mutated gene in melanoma. Constitutive activation of mutant BRAFV600E leads to aberrant Ras-independent MAPK signaling and cell transformation. Inhibition of mutant BRAF is a current frontline therapy for such cases, with improved survival compared with chemotherapy. Unfortunately, reactivation of MAPK signaling by several mechanisms has been shown to cause drug resistance and disease recurrence. In this work, we describe the co-occurrence of an in-frame deletion within an amplified BRAFV600E locus and a missense point mutation of the transcriptional repressor BCORL1 in vemurafenib-resistant A375 melanoma cells. Functional data confirmed that truncated p47BRAFV600E and mutant BCORL1Q1076H both contribute to resistance. Interestingly, either endogenous BCORL1 silencing or ectopic BCORL1Q1076H expression mimicked the effects of a CRISPR/Cas9-edited BCORL1Q1076H locus, suggesting a complex mixture of loss- and gain-of-function effects caused by the mutation. Transcriptomic data confirmed this hypothesis. Finally, we show that the pan-RAF inhibitor sorafenib is not affected by expression of BRAF deletion variant and effectively synergizes with vemurafenib to block resistant cells, suggesting a possible intervention for this class of mutants.


Figures

Figure 1
Figure 1
Characterization of vemurafenib-resistant cells. (A) Dose-response curves of A375 and A375-R1 cells in the presence of increasing concentrations of vemurafenib. The proliferation rate of vehicle-treated controls is set as 100%. (B) Western blot analysis of A375 and A375-R1 cell lysates after 4-hour treatment with the indicated concentrations of vemurafenib. The membranes were probed with antibodies recognizing phosphorylated (pMEK) and total MEK1/2 proteins. (C) Quantitative real-time PCR showing similar BRAF transcription in parental and resistant cells. GAPDH was used for normalization. (D) In vitro kinase activity of immunoprecipitated BRAF from A375 and A375-R1 cells on a GST-MEK1 substrate. Left: The reaction was run in the absence or presence of ATP. Right: ATP was added in all samples in the presence of the indicated concentrations of vemurafenib. Reactions were stopped by Laemmli buffer, run on SDS-PAGE, and probed with anti-pMEK antibody. Anti-BRAF blot is shown for loading check.
Figure 2
Figure 2
BRAF and BCORL1 mutations in resistant cells. (A) Whole-exome sequencing copy number variation analysis revealed focal imbalances of the distal region of chromosome 7 in A375-R1 cells compared to parental cells. BRAF locus (zoomed area) lies within the amplified region but shows loss of exons 2 to 8. (B) Sanger sequencing of the deleted BRAF allele showing in-frame junction of exon 1 with exon 9 in A375-R1 cells. (C) PCR amplification of the region across the break point reveals the presence of two BRAF transcripts in A375-R1 cells: full-length wild-type (1216-bp band) and truncated (213-bp band). (D) Anti-BRAF Western blotting shows the presence of a smaller band of approximately 47kDa in A375-R1 cells. Actin is shown as a loading control. (E) siRNA-mediated silencing of BRAF in A375-R1 cells leads to downregulation of both full-length and truncated BRAF proteins, suppression of MEK1/2 phosphorylation, and decrease in cell viability. (F) Whole-exome sequencing comparative analysis of A375-R1 versus A375 cells revealed acquired mutations in the four indicated genes at frequency >35%. SIFT prediction of mutation impact on protein function is shown. (G) Sanger validation of BCORL1 heterozygous genomic mutation in A375-R1 cells.
Figure 3
Figure 3
Functional validation of mutations. (A-C) Transient co-transfection of p47BRAFV600E and BCORL1Q1076H conferred partial resistance to vemurafenib-mediated inhibition of A375 cell growth (A) and MAPK signaling (C). Forty-eight hours after transfection, the cells were challenged for additional 48 (A) or 4 (C) hours with vemurafenib and harvested. Cell proliferation shown in A was detected by thymidine incorporation. (B) Histogram plot from two proliferation experiments (mean ± SEM). MAPK pathway activity shown in C was detected by Western blotting as MEK and ERK phosphorylation. (D-G) Stably transfected A375 clones expressing HA-tagged p47BRAFV600E (D, Western blot, clone E9) and wild-type or mutated BCORL1 (E, qPCR), singularly or combined, were isolated and tested in proliferation assays for vemurafenib sensitivity. Data from at least four independent experiments are reported as mean ± SEM IC50 values (F); the red bar represents A375-R1 cells, for comparison; ev, empty vector. (G) Representative Western blot showing MEK1/2 phosphorylation (pMEK) in transfected cells treated with the indicated vemurafenib doses for 4 hours. Actin is shown as a control. (H) Correlation between p47BRAFV600E expression (x-axis, log scale) determined by p47-specific qPCR and vemurafenib IC50 (y-axis, log scale). Clone E9, used for all experiments, is indicated. (I) Upper panel: siRNA-mediated silencing of BCORL1 (siBCORL1) and BRAF (siBRAF) in A375-R1 cells; a nontargeting scrambled siRNA (siNT) was used as a control. Lysates were probed with the indicated antibodies. Lower panel: Parental A375 cells were transiently transfected with empty vector, wild-type (WT), or mutated (Q1076H) BCORL1 and checked for BRAF expression. Actin is shown for loading control.
Figure 4
Figure 4
Stable knockdown of BCORL1 in A375 cells (A-C) and A375-p47BRAFV600E [clone E9] (D-F). (A, D) Efficiency of shRNA-mediated BCORL1 silencing as shown by quantitative PCR using GAPDH as a reference gene. (B, E) Dose-response curves obtained in the presence of increasing concentrations of vemurafenib, with cells expressing a nontargeting (shNT, blue curves) or a BCORL1-specific (shBCORL1, red curves) shRNA. (C, F) CRISPR/Cas9 system was used to disrupt BCORL1 gene; vemurafenib dose-response curves are shown comparing knockout (KO) with parental (WT) cells. (G) CRISPR/Cas9-mediated gene editing was used to introduce the Q1076H substitution in the endogenous BCORL1 locus; vemurafenib dose-response curves are shown comparing two mutated clones (C8 and D7) with a wild-type clone (WT) and with parental A375 cells (Par). All curves are representative of at least three experiments. For all panels, extra-sum-of-squares F test was run to compare the two curves; Pvalues are indicated at the lower-left corner, where P < .05 indicates that the curves are significantly different. (H) Summary of IC50 data (mean ± SEM) obtained from all experiments. For each comparison, control cells IC50 (blue bars, shNT or WT) is set to 1; test cells IC50 value (red bars, shBCORL1 or KO) is normalized over its control. Student's t test was used to compare IC50s. *P < .05; **P < .01.
Figure 5
Figure 5
Transcriptomic analysis of A375 stably overexpressing wild-type (WT) or mutated (MUT) BCORL1 compared to parental (Par) A375. Venn diagrams (A, C) show the number of differentially expressed genes (DEGs) versus Par. Heatmaps (B, D) show hierarchical clustering of genes significantly dysregulated by WT versus Par (B, down; D, up). Note that regulation obtained by WT samples is partially lost in MUT samples. (E-F) Functional annotation of significant DEGs in WT (E) and MUT (F) samples; red, upregulated genes; green, downregulated genes; a dotted line indicates P = .05.
Figure 6
Figure 6
(A) Western blot shows inhibition of pMEK by GDC-0879, but not by vemurafenib (vem), in A375-R1 cells. (B) Dose-response curves of sorafenib showing equal sensitivity of A375 (blue) and A375-R1 (red) cells. (C) A375 and A375-R1 cells were treated for 4 hours with the indicated drugs and analyzed by Western blot. In A375-R1 cells, MAPK signaling is sensitive to sorafenib (1 μM) and fully suppressed by combined treatment. (D) In vitro kinase assay of immunoprecipitated BRAF (see Figure 1D) in the presence of vemurafenib, sorafenib, or both. (E) Dose-response curves of vemurafenib alone (red) or in the presence of sorafenib 0.3 μM (blue) or 1 μM (green) in A375-R1 cells. (F) Dose-response curves of trametinib showing equal sensitivity of A375 (blue) and A375-R1 (red) cells.

Similar articles

Cited by

References

    1. Gambacorti-Passerini C, Piazza R. How I treat newly diagnosed chronic myeloid leukemia in 2015. Am J Hematol. 2015;90(2):156–161. - PubMed
    1. Gambacorti Passerini C, Farina F, Stasia A, Redaelli S, Ceccon M, Mologni L, Messa C, Guerra L, Giudici G, Sala E. Crizotinib in advanced, chemoresistant anaplastic lymphoma kinase-positive lymphoma patients. J Natl Cancer Inst. 2014;106(2) - PubMed
    1. Krajewska J, Olczyk T, Jarzab B. Cabozantinib for the treatment of progressive metastatic medullary thyroid cancer. Expert Rev Clin Pharmacol. 2016;9(1):69–79. - PubMed
    1. Pao W, Chmielecki J. Rational, biologically based treatment of EGFR-mutant non-small-cell lung cancer. Nat Rev Cancer. 2010;10(11):760–774. - PMC - PubMed
    1. Davies H, Bignell GR, Cox C, Stephens P, Edkins S, Clegg S, Teague J, Woffendin H, Garnett MJ, Bottomley W. Mutations of the BRAF gene in human cancer. Nature. 2002;417(6892):949–954. - PubMed

Publication types

MeSH terms