. 2018 Jun;59(6):958-966.
doi: 10.1194/jlr.M079251. Epub 2018 Mar 31.

Regulation of kynurenine metabolism by a ketogenic diet

Affiliations

Regulation of kynurenine metabolism by a ketogenic diet

Svenja Heischmann et al. J Lipid Res. 2018 Jun.

Abstract

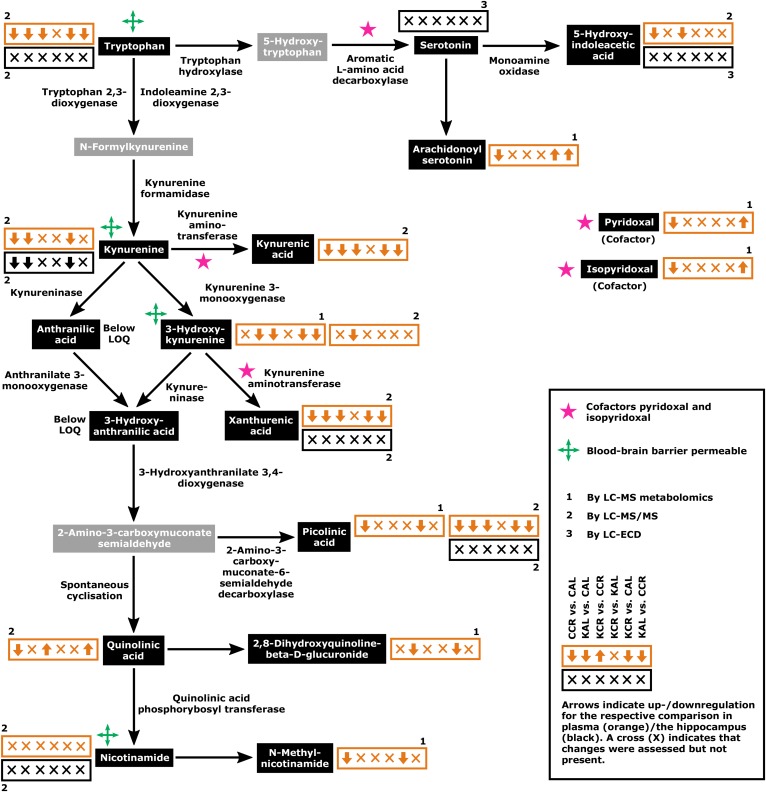
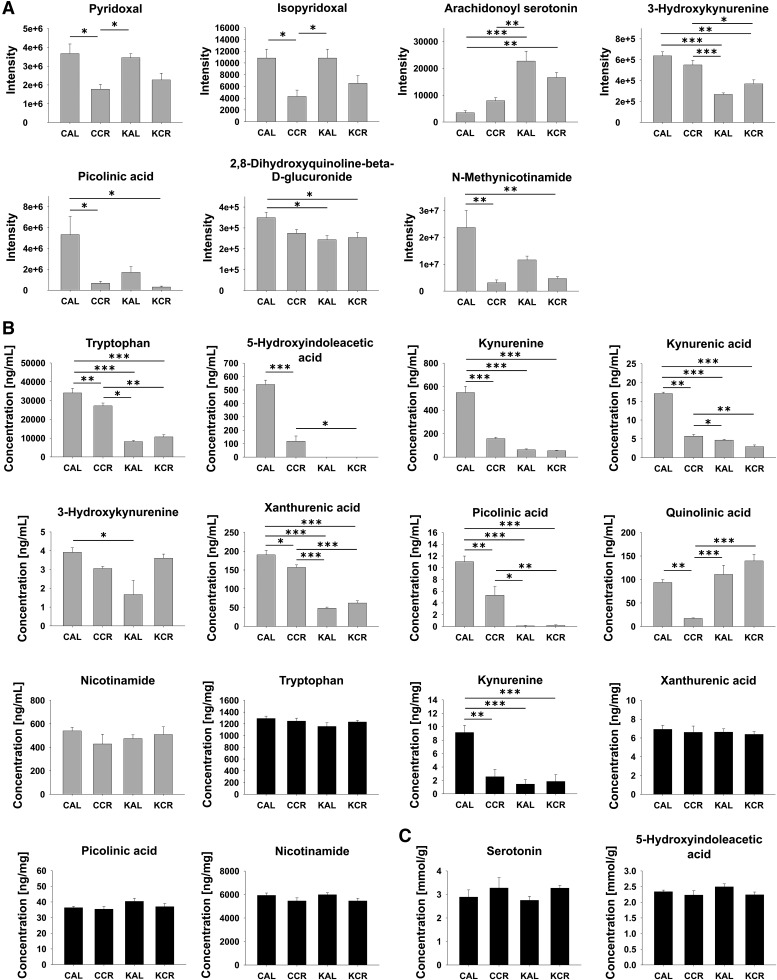
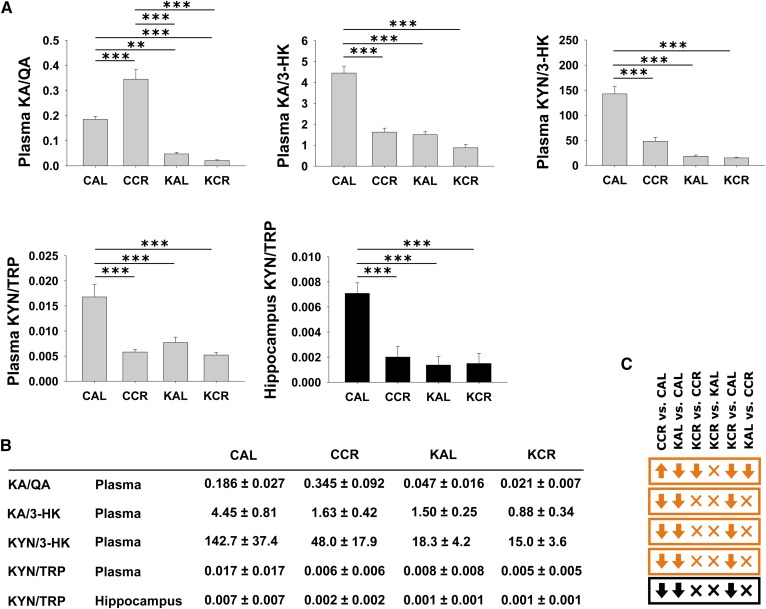
Ketogenic diets (KDs) are increasingly utilized as treatments for epilepsy, other neurological diseases, and cancer. Despite their long history in suppressing seizures, the distinct molecular mechanisms of action of KDs are still largely unknown. The goal of this study was to identify key metabolites and pathways altered in the hippocampus and plasma of rats fed a KD versus control diet (CD) either ad libitum or calorically restricted to 90% of the recommended intake. This was accomplished using a combination of targeted methods and untargeted MS-based metabolomics analyses. Various metabolites of and related to the tryptophan (TRP) degradation pathway, such as kynurenine (KYN), kynurenic acid as well as enzyme cofactors, showed significant changes between groups fed different diets and/or calorie amounts in plasma and/or the hippocampus. KYN was significantly downregulated in both matrices in animals of the CD-calorically restricted, KD-ad libitum, and KD-calorically restricted groups compared with the CD-ad libitum group. Our data suggest that the TRP degradation pathway is a key target of the KD.

Keywords: brain; caloric restriction; diet effects/lipid metabolism; epilepsy; kynurenic acid; kynurenine pathway; mass spectrometry; metabolomics; nutrition; tryptophan.


Figures

Fig. 1.
Fig. 1.
Key elements of the KYN pathway and associated metabolites. Arrows in orange (plasma) and black (hippocampus) boxes show the regulation of the respective metabolites for the six comparisons in the following order: CCR versus CAL, KAL versus CAL, KCR versus CCR, KCR versus KAL, KCR versus CAL, and KAL versus CCR. Numbers indicate the respective methods of assessment: 1, LC-MS metabolomics analysis; 2, LC-MS/MS; 3, LC-ECD. Concentrations of metabolites shown in gray boxes were not assessed. Graphs of metabolite concentrations with detailed statistical comparison are shown in Fig. 2. LOQ, limit of quantitation.
Fig. 2.
Fig. 2.
Changes in metabolites of or (possibly) related to the KYN pathway in plasma (gray plots) and hippocampi (black plots) in rats fed according to the four dietary regimens, CAL, CCR, KAL, and KCR. Data are presented as the mean + standard error of the mean (n = 6). A: Changes assessed by HPLC-MS metabolomics analysis. B: Changes assessed by HPLC-MS/MS. C: Changes assessed by HPLC-ECD. P values for comparison by two-way ANOVA are reported in supplemental Table S3. For comparisons between groups, Tukey’s post hoc tests were used (*P < 0.05, **P < 0.01, ***P < 0.001).
Fig. 3.
Fig. 3.
Graphs of specific KP metabolite ratios as measured by LC-MS/MS in plasma (gray plots) and hippocampus (black plots) of rats fed the respective diets and caloric amounts (A). KYN pathway metabolite ratios (B). Arrows in orange (plasma) and black (hippocampus) boxes show the regulation of the respective metabolites for the six comparisons in the following order: CCR versus CAL, KAL versus CAL, KCR versus CCR, KCR versus KAL, KCR versus CAL, and KAL versus CCR (C). KA/QA, KA/3-HK, and KYN/3-HK were not calculated for the hippocampus, as the respective metabolite concentrations were below the limit of quantitation. Data are presented as mean + standard error of the mean (n = 6). P values for comparison by two-way ANOVA are reported in supplemental Table S4. For comparisons between groups, Tukey’s post hoc tests were used (*P < 0.05, **P < 0.01, ***P < 0.001).

References

    1. Gano L. B., Patel M., and Rho J. M.. 2014. Ketogenic diets, mitochondria, and neurological diseases. J. Lipid Res. 55: 2211–2228. - PMC - PubMed
    1. Lutas A., and Yellen G.. 2013. The ketogenic diet: metabolic influences on brain excitability and epilepsy. Trends Neurosci. 36: 32–40. - PMC - PubMed
    1. Dahlin M., Elfving A., Ungerstedt U., and Amark P.. 2005. The ketogenic diet influences the levels of excitatory and inhibitory amino acids in the CSF in children with refractory epilepsy. Epilepsy Res. 64: 115–125. - PubMed
    1. Yamada K. A. 2008. Calorie restriction and glucose regulation. Epilepsia. 49 (Suppl. 8): 94–96. - PubMed
    1. Kawamura M., Ruskin D. N., Geiger J. D., Boison D., and Masino S. A.. 2014. Ketogenic diet sensitizes glucose control of hippocampal excitability. J. Lipid Res. 55: 2254–2260. - PMC - PubMed

Publication types

LinkOut - more resources