

Defining Regulatory Elements in the Human Genome Using Nucleosome Occupancy and Methylome Sequencing (NOMe-Seq)
- PMID: 29605855
- PMCID: PMC6019634
- DOI: 10.1007/978-1-4939-7768-0_12
Defining Regulatory Elements in the Human Genome Using Nucleosome Occupancy and Methylome Sequencing (NOMe-Seq)
Abstract
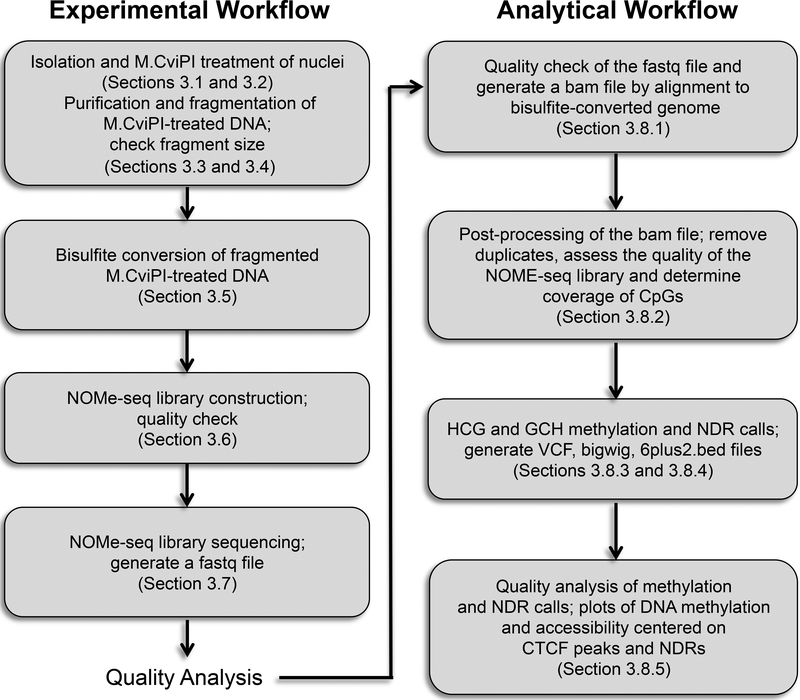
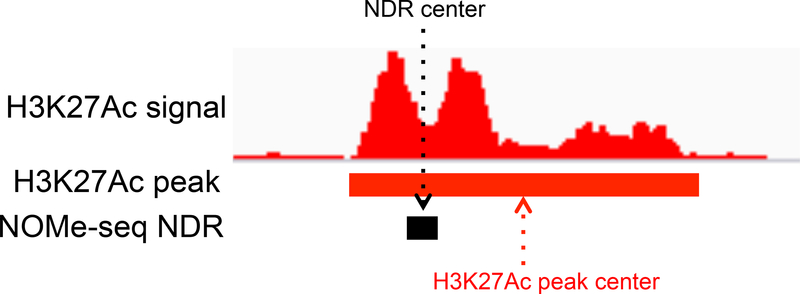
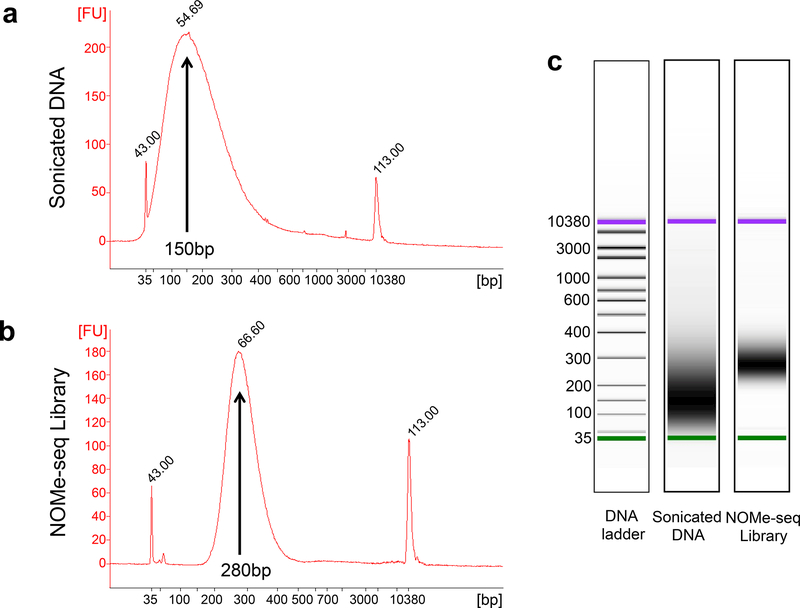
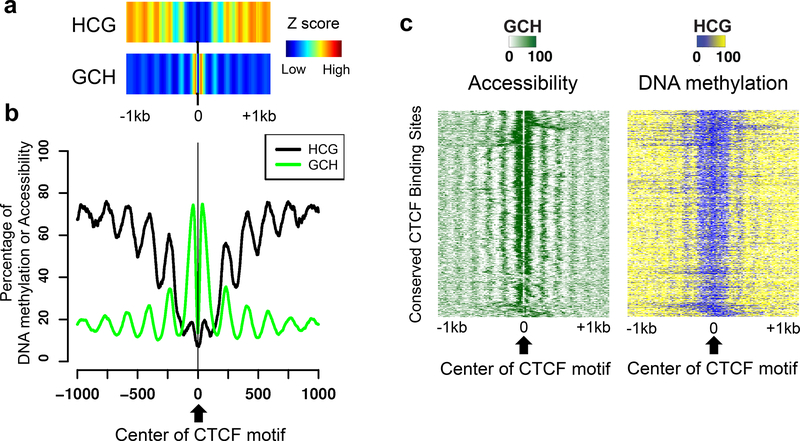
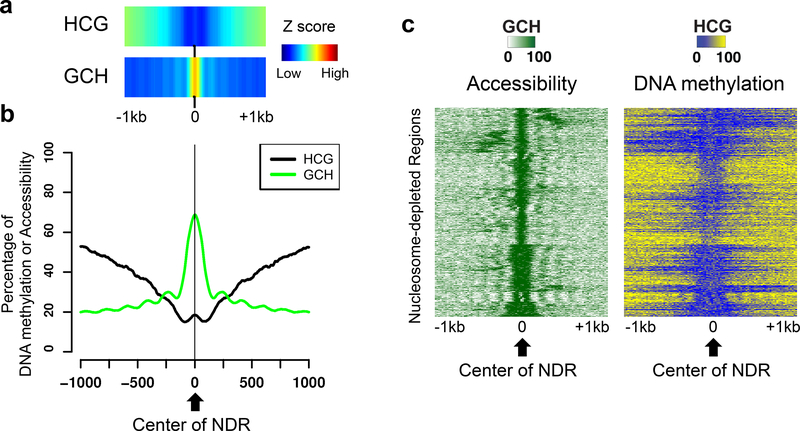
NOMe-seq (nucleosome occupancy and methylome sequencing) identifies nucleosome-depleted regions that correspond to promoters, enhancers, and insulators. The NOMe-seq method is based on the treatment of chromatin with the M.CviPI methyltransferase, which methylates GpC dinucleotides that are not protected by nucleosomes or other proteins that are tightly bound to the chromatin (GpCm does not occur in the human genome and therefore there is no endogenous background of GpCm). Following bisulfite treatment of the M.CviPI-methylated chromatin (which converts unmethylated Cs to Ts and thus allows the distinction of GpC from GpCm) and subsequent genomic sequencing, nucleosome-depleted regions can be ascertained on a genome-wide scale. The bisulfite treatment also allows the distinction of CpG from CmpG (most endogenous methylation occurs at CpG dinucleotides) and thus the endogenous methylation status of the genome can also be obtained in the same sequencing reaction. Importantly, open chromatin is expected to have high levels of GpCm but low levels of CmpG; thus, each of the two separate methylation analyses serve as independent (but opposite) measures which provide matching chromatin designations for each regulatory element.NOMe-seq has advantages over ChIP-seq for identification of regulatory elements because it is not reliant upon knowing the exact modifications on the surrounding nucleosomes. Also, NOMe-seq has advantages over DHS (DNase hypersensitive site)-seq, FAIRE (Formaldehyde-Assisted Isolation of Regulatory Elements)-seq, and ATAC (Assay for Transposase-Accessible Chromatin)-seq because it also gives positioning information for several nucleosomes on either side of each open regulatory element. Here, we provide a detailed protocol for NOMe-seq that begins with the isolation of chromatin, followed by methylation of GpCs with M.CviPI and treatment with bisulfite, and ending with the creation of next generation sequencing libraries. We also include sequencing QC analysis metrics and bioinformatics steps that can be used to identify nucleosome-depleted regions throughout the genome.
Keywords: DNA methylation; Enhancers; Insulators; NOMe-seq; Nucleosome-depleted regions; Open chromatin; Promoters.
Figures
Similar articles
-
Nucleosome Occupancy and Methylome Sequencing (NOMe-seq).Methods Mol Biol. 2018;1708:267-284. doi: 10.1007/978-1-4939-7481-8_14. Methods Mol Biol. 2018. PMID: 29224149
-
Links between DNA methylation and nucleosome occupancy in the human genome.Epigenetics Chromatin. 2017 Apr 11;10:18. doi: 10.1186/s13072-017-0125-5. eCollection 2017. Epigenetics Chromatin. 2017. PMID: 28413449 Free PMC article.
-
Genome-wide mapping of nucleosome positioning and DNA methylation within individual DNA molecules.Genome Res. 2012 Dec;22(12):2497-506. doi: 10.1101/gr.143008.112. Epub 2012 Sep 7. Genome Res. 2012. PMID: 22960375 Free PMC article.
-
[Advances in assay for transposase-accessible chromatin with high-throughput sequencing].Yi Chuan. 2020 Apr 20;42(4):333-346. doi: 10.16288/j.yczz.19-279. Yi Chuan. 2020. PMID: 32312702 Review. Chinese.
-
Analyzing the cancer methylome through targeted bisulfite sequencing.Cancer Lett. 2013 Nov 1;340(2):171-8. doi: 10.1016/j.canlet.2012.10.040. Epub 2012 Nov 28. Cancer Lett. 2013. PMID: 23200671 Free PMC article. Review.
Cited by
-
Characterizing chromatin interactions of regulatory elements and nucleosome positions, using Hi-C, Micro-C, and promoter capture Micro-C.Epigenetics Chromatin. 2022 Dec 21;15(1):41. doi: 10.1186/s13072-022-00473-4. Epigenetics Chromatin. 2022. PMID: 36544209 Free PMC article.
-
Efficiently quantifying DNA methylation for bulk- and single-cell bisulfite data.Bioinformatics. 2023 Jun 1;39(6):btad386. doi: 10.1093/bioinformatics/btad386. Bioinformatics. 2023. PMID: 37326968 Free PMC article.
-
Filtering the Junk: Assigning Function to the Mosquito Non-Coding Genome.Insects. 2021 Feb 22;12(2):186. doi: 10.3390/insects12020186. Insects. 2021. PMID: 33671692 Free PMC article. Review.
-
Factors and Methods for the Detection of Gene Expression Regulation.Biomolecules. 2023 Feb 6;13(2):304. doi: 10.3390/biom13020304. Biomolecules. 2023. PMID: 36830673 Free PMC article. Review.
-
A high-resolution 3D epigenomic map reveals insights into the creation of the prostate cancer transcriptome.Nat Commun. 2019 Sep 12;10(1):4154. doi: 10.1038/s41467-019-12079-8. Nat Commun. 2019. PMID: 31515496 Free PMC article.
References
-
- ENCODE Project Consortium (2012) An integrated encyclopedia of DNA elements in the human genome. Nature 489 (7414):57–74. doi:10.1038/Nature11247 - DOI - PMC - PubMed
-
- Rada-Iglesias A, Bajpai R, Swigut T, Brugmann SA, Flynn RA, Wysocka J (2011) A unique chromatin signature uncovers early developmental enhancers in humans. Nature 470 (7333):279–283. doi:nature09692 [pii] 10.1038/nature09692 [doi] - DOI - PMC - PubMed
-
- Heintzman ND, Ren B (2009) Finding distal regulatory elements in the human genome. Current opinion in genetics & development 19 (6):541–549. doi:10.1016/j.gde.2009.09.006 - DOI - PMC - PubMed
-
- Heintzman ND, Stuart RK, Hon G, Fu Y, Ching CW, Hawkins RD, Barrera LO, Van Calcar S, Qu C, Ching KA, Wang W, Weng Z, Green RD, Crawford GE, Ren B (2007) Distinct and predictive chromatin signatures of transcriptional promoters and enhancers in the human genome. Nature genetics 39 (3):311–318. doi:10.1038/ng1966 - DOI - PubMed
MeSH terms
Substances
Grants and funding
LinkOut - more resources
Full Text Sources
Other Literature Sources
