. 2018 Apr 5;102(4):592-608.
doi: 10.1016/j.ajhg.2018.02.017. Epub 2018 Mar 29.

PheWAS and Beyond: The Landscape of Associations with Medical Diagnoses and Clinical Measures across 38,662 Individuals from Geisinger

Affiliations

PheWAS and Beyond: The Landscape of Associations with Medical Diagnoses and Clinical Measures across 38,662 Individuals from Geisinger

Anurag Verma et al. Am J Hum Genet. .

Abstract

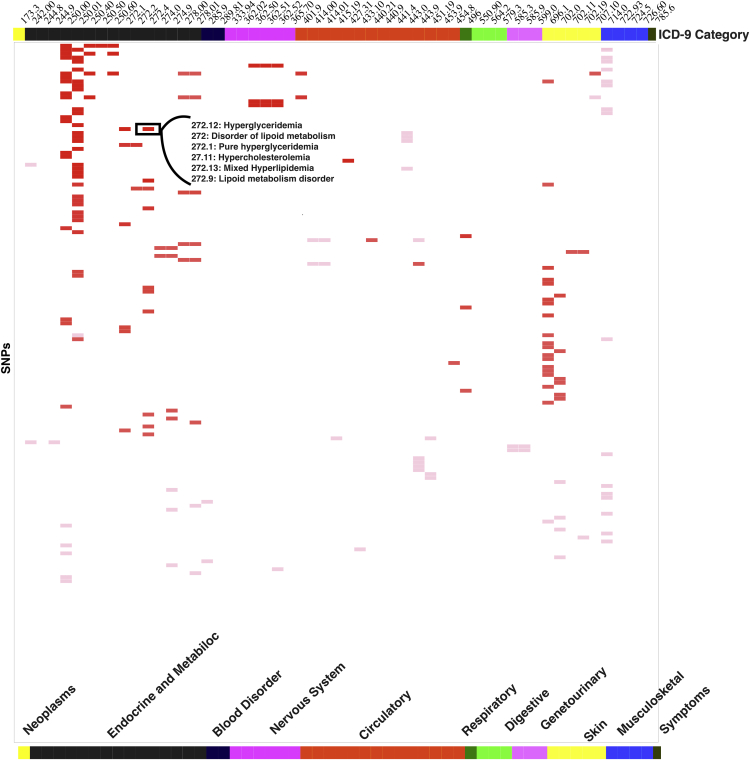
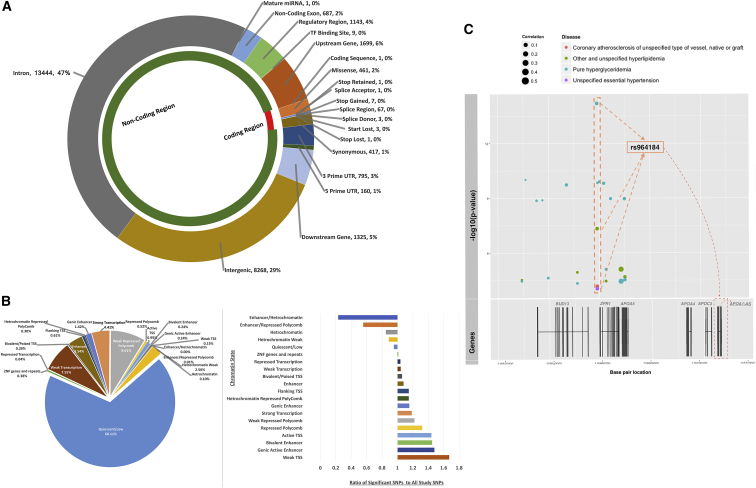
Most phenome-wide association studies (PheWASs) to date have used a small to moderate number of SNPs for association with phenotypic data. We performed a large-scale single-cohort PheWAS, using electronic health record (EHR)-derived case-control status for 541 diagnoses using International Classification of Disease version 9 (ICD-9) codes and 25 median clinical laboratory measures. We calculated associations between these diagnoses and traits with ∼630,000 common frequency SNPs with minor allele frequency > 0.01 for 38,662 individuals. In this landscape PheWAS, we explored results within diseases and traits, comparing results to those previously reported in genome-wide association studies (GWASs), as well as previously published PheWASs. We further leveraged the context of functional impact from protein-coding to regulatory regions, providing a deeper interpretation of these associations. The comprehensive nature of this PheWAS allows for novel hypothesis generation, the identification of phenotypes for further study for future phenotypic algorithm development, and identification of cross-phenotype associations.

Keywords: EHR; GWAS; PheWAS; bioinformatics; biorepository; genetic epidemiology; genomics; phenome-wide.


Figures

Figure 1
Figure 1
Correlation between Chromatin State and Genes via RNA-Seq Data For a given region such as region 1 shown on chromosome 9 in the figure, we calculated the correlation between the predicted chromatin state and gene expression using data from 56 tissues provided by the Roadmap Epigenome Consortium. The size of the regions was 200 bp in length, the same as used by IDEAS for chromatin state prediction. In this example, there are three genes in vicinity of “region 1” (±100 kb): G1, G2, and G3. Next, we generated a matrix of gene expression measures (RPKM values), represented in the matrix on the left in the middle of Figure 1. For each gene, we performed regression between the gene expression, log10(RPKM + 0.001), and the binary measures of a 20-state chromatin model from IDEAS (matrix on the right in the middle of figure). The output is the adjusted r2 between the “region 1” and the three genes. We used only the gene with highest r2 value for a given genomic region, which would be G2 in this example.
Figure 2
Figure 2
Fine Mapping of PheWAS Results We annotated our PheWAS associations with most probable chromatin state and the correlation of chromatin state with gene expression data. For each phenotype, we identified a haplotype block of variants with association p values < 1 × 10−4, then we annotated each variant within the haplotype block to identify the variant based on state with the highest value of r2 to the expression of a given gene. In this example, SNP RS3 is the variant overlapping region 2, the region that G2 is located within.
Figure 3
Figure 3
Landscape of Genome-wide PheWAS Results We plotted the association results with p value < 1 × 10−4, using −log10(p value). Each association is represented in relation to the SNP location on each chromosome and the points are color-coded by ICD-9 code categories in (A) and clinical laboratory measures in (B). A triangle indicates that the association is previously reported and a circle represents a previously unreported association. The red line is at the phenome-wide significance p value threshold for each PheWAS. We indicated the phenotypes of a few of the most significant associations.
Figure 4
Figure 4
Integrating ICD-9 and Clinical Lab PheWAS We present a position-by-position comparison of genetic associations the two PheWASs, one with 541 ICD-9 diagnosis codes and the other with 25 clinical laboratory measures. The horizontal axis represents genomic locations by each chromosome and the vertical axis is the –log10(p value) of the associations. The red and blue dotted lines are the phenome-wide significance threshold for ICD-9 and clinical lab PheWAS, respectively. We annotated examples of associations between the same SNP and highly related phenotypes across the two PheWASs.
Figure 5
Figure 5
Replicating Published PheWASs Here we plotted SNP phenotype associations replicating previously published PheWAS results from studies using ICD-9 code-based diagnoses. The top axis is all the ICD-9 codes from this study, and the rows represent SNPs. The gradient of the color in the matrix represents the number of associations replicating between our study and existing PheWAS results for each SNP-phenotype pair.
Figure 6
Figure 6
Functional Annotations (p Value < 1 × 10−4) (A) We used Variant Effect Predictor (VEP) to identify functional consequences of the genetic variants in our study for the ICD-9-based PheWAS results. The plot shows the number of variants of each type of predicted consequence classifying SNPs across the coding and noncoding regions of the genome. (B) The pie chart on the left is the representation of SNPs annotated to the most probable chromatin region across 127 epigenomes. The plot on the right shows the overall representation of each chromatin state for variants with significant results when compared to annotations of all the variants included in the study. (C) In the plot, the scatterplot represents associations within a haplotype block on chromosome 11 where the horizontal axis is base pair location and –log10(p value) is shown on the vertical axis. The color of the circles represent phenotypes and size of the circle corresponds to pre-computed gene correlation measure (r2) for that region in roadmap epigenomes. The genes close by to that haplotype block are represented below the scatterplot. Based on haplotype block annotations, SNP rs964184 shows the highest correlation (highest r2) with the expression of APOA1.

References

    1. Hall M.A., Verma A., Brown-Gentry K.D., Goodloe R., Boston J., Wilson S., McClellan B., Sutcliffe C., Dilks H.H., Gillani N.B. Detection of pleiotropy through a phenome-wide association study (PheWAS) of epidemiologic data as part of the Environmental Architecture for Genes Linked to Environment (EAGLE) study. PLoS Genet. 2014;10:e1004678. - PMC - PubMed
    1. Denny J.C., Ritchie M.D., Basford M.A., Pulley J.M., Bastarache L., Brown-Gentry K., Wang D., Masys D.R., Roden D.M., Crawford D.C. PheWAS: demonstrating the feasibility of a phenome-wide scan to discover gene-disease associations. Bioinformatics. 2010;26:1205–1210. - PMC - PubMed
    1. Pendergrass S.A., Brown-Gentry K., Dudek S., Frase A., Torstenson E.S., Goodloe R., Ambite J.L., Avery C.L., Buyske S., Bůžková P. Phenome-wide association study (PheWAS) for detection of pleiotropy within the Population Architecture using Genomics and Epidemiology (PAGE) Network. PLoS Genet. 2013;9:e1003087. - PMC - PubMed
    1. Verma A., Basile A.O., Bradford Y., Kuivaniemi H., Tromp G., Carey D., Gerhard G.S., Crowe J.E., Jr., Ritchie M.D., Pendergrass S.A. Phenome-wide association study to explore relationships between immune system related genetic loci and complex traits and diseases. PLoS ONE. 2016;11:e0160573. - PMC - PubMed
    1. Namjou B., Marsolo K., Caroll R.J., Denny J.C., Ritchie M.D., Verma S.S., Lingren T., Porollo A., Cobb B.L., Perry C. Phenome-wide association study (PheWAS) in EMR-linked pediatric cohorts, genetically links PLCL1 to speech language development and IL5-IL13 to eosinophilic esophagitis. Front. Genet. 2014;5:401. - PMC - PubMed

Publication types