. 2018 Apr 9;33(4):736-751.e5.
doi: 10.1016/j.ccell.2018.02.011. Epub 2018 Mar 29.

GKAP Acts as a Genetic Modulator of NMDAR Signaling to Govern Invasive Tumor Growth

Affiliations

GKAP Acts as a Genetic Modulator of NMDAR Signaling to Govern Invasive Tumor Growth

Leanne Li et al. Cancer Cell. .

Abstract

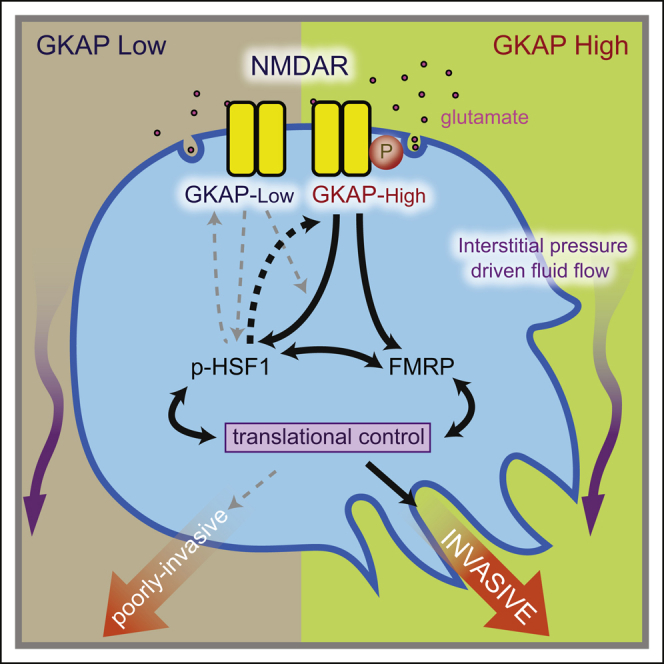
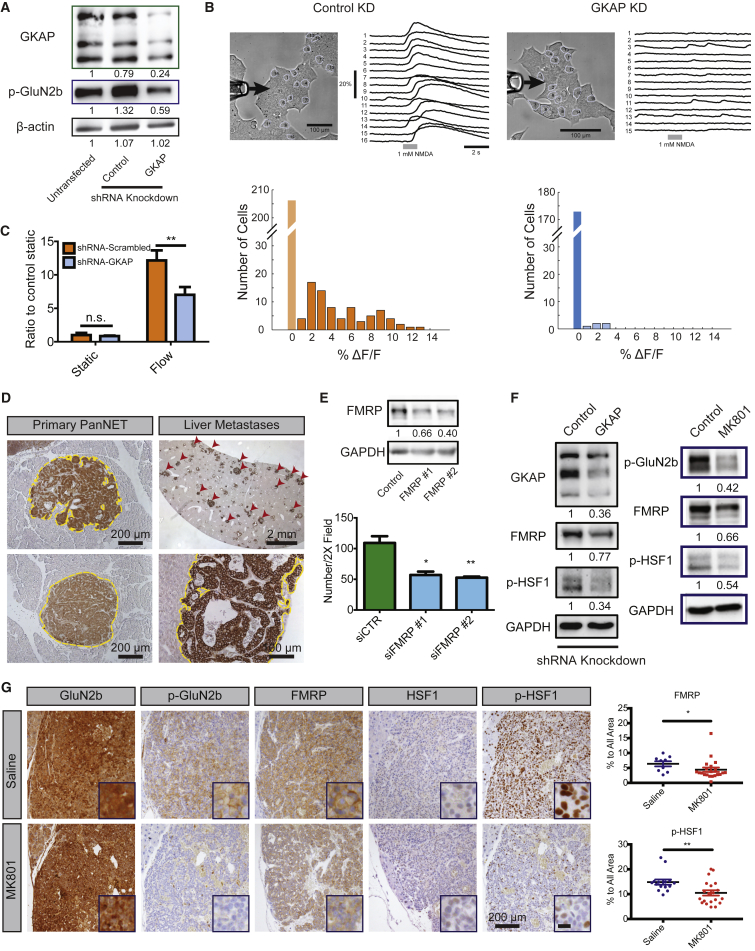
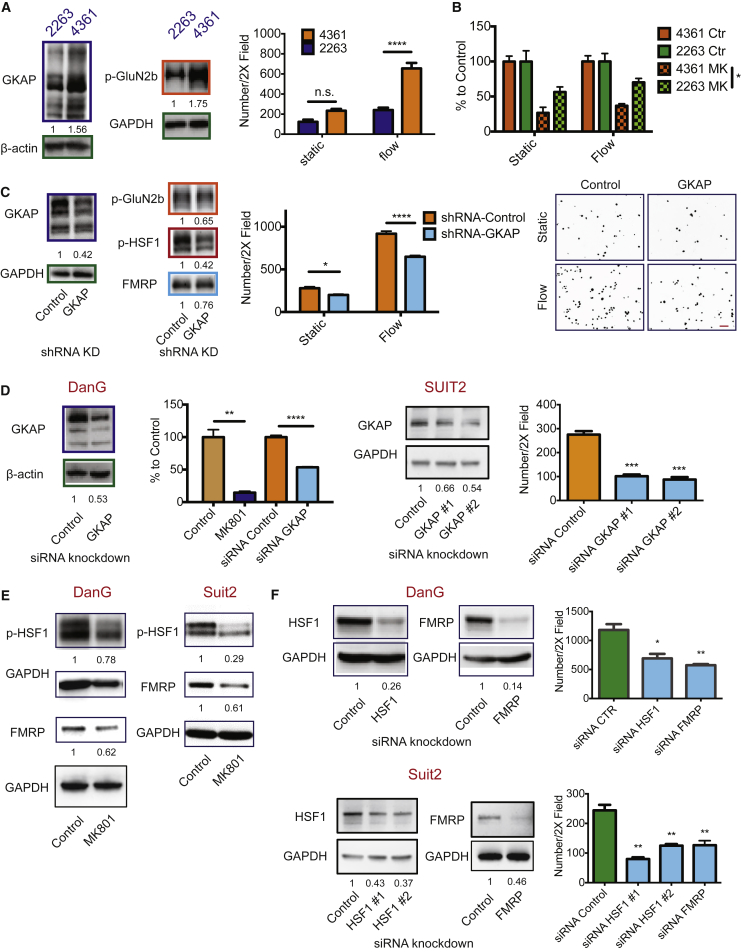
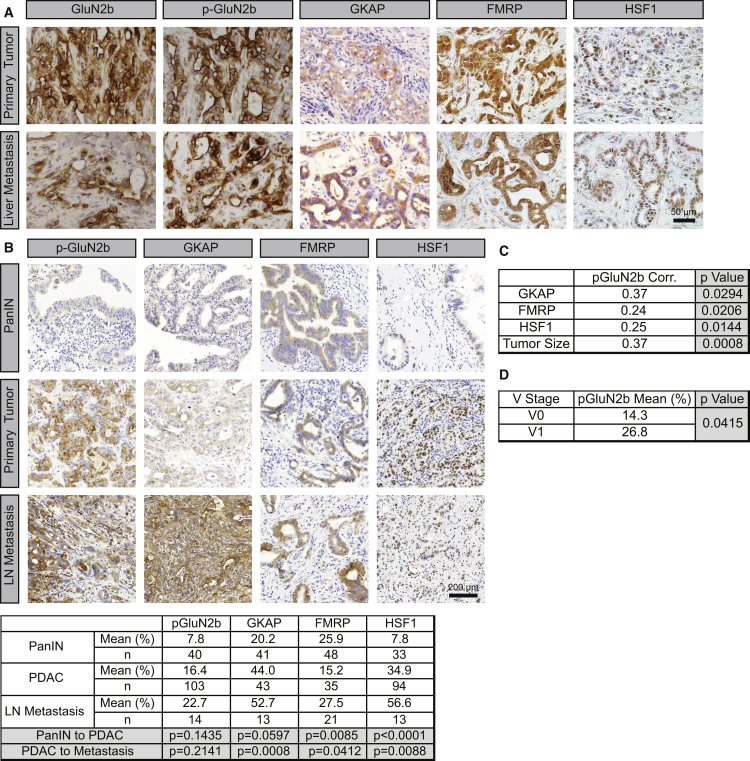
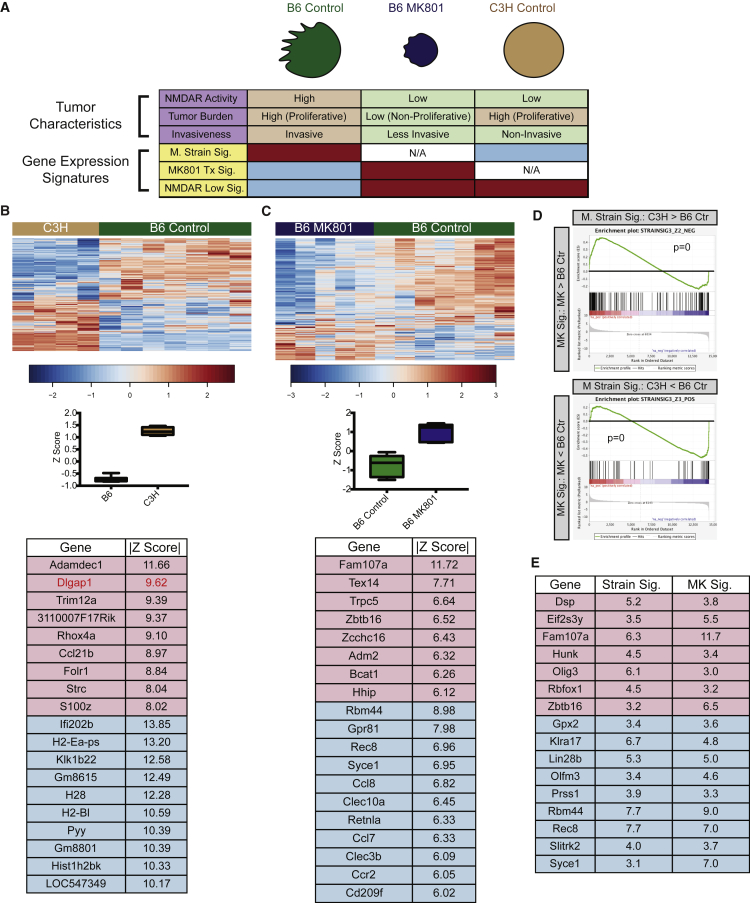
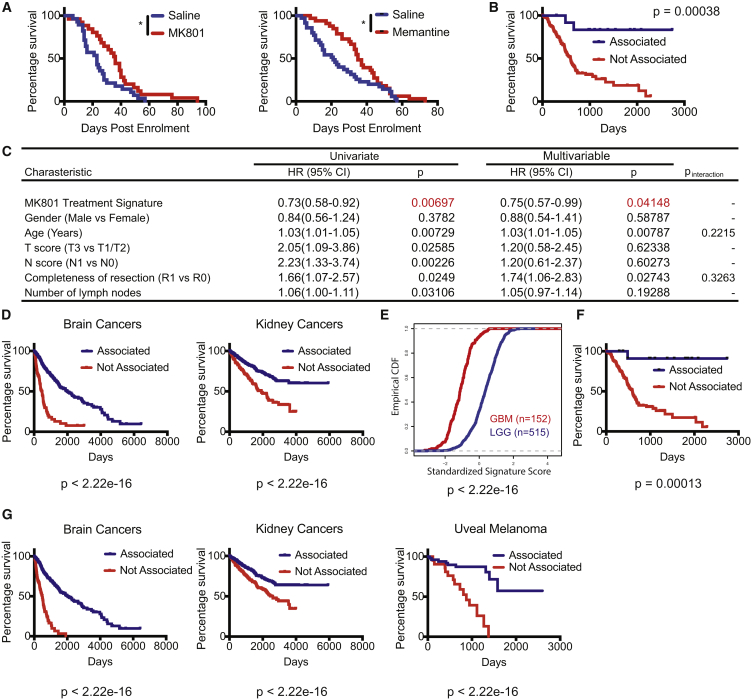
Genetic linkage analysis previously suggested that GKAP, a scaffold protein of the N-methyl-D-aspartate receptor (NMDAR), was a potential modifier of invasion in a mouse model of pancreatic neuroendocrine tumor (PanNET). Here, we establish that GKAP governs invasive growth and treatment response to NMDAR inhibitors of PanNET via its pivotal role in regulating NMDAR pathway activity. Combining genetic knockdown of GKAP and pharmacological inhibition of NMDAR, we implicate as downstream effectors FMRP and HSF1, which along with GKAP demonstrably support invasiveness of PanNET and pancreatic ductal adenocarcinoma cancer cells. Furthermore, we distilled genome-wide expression profiles orchestrated by the NMDAR-GKAP signaling axis, identifying transcriptome signatures in tumors with low/inhibited NMDAR activity that significantly associate with favorable patient prognosis in several cancer types.

Keywords: FMRP; GKAP/Dlgap1; GluN2b/NR2b/Grin2b; HSF1; MK801; NMDAR; RIP1Tag2; cancer modifier; glutamate receptor; memantine; pancreatic ductal adenocarcinoma (PDAC).


Figures

None
Graphical abstract
Figure 1
Figure 1
Differential GKAP Expression between the C57/BL6 and C3HeB/Fe Genetic Backgrounds Is Associated with a Differential NMDAR Pathway Activity In Vitro (A) qRT-PCR of Dlgap1 mRNA (upper) and western blot for GKAP protein expression (lower) in mPanNET tumor-derived cancer cell lines (βTC-B6 and βTC-C3H) or primary tumors that arose in RIP1Tag2 transgenic mice inbred into the B6 and C3H backgrounds, respectively. p < 0.05; ∗∗p < 0.01 (n = 3 individual tumors/genetic background; n = 3 independent RNA extraction/cell line). (B) qRT-PCR analysis of FACS-sorted cell types from primary tumors derived from B6 mice. Cells were sorted from pools of multiple PanNETs isolated from two mice. One-way ANOVA, Dunnett multiple comparisons test was used when cancer cells were compared with all other populations (p < 0.0001 in all comparisons). (C) Upper panel: a region within the Dlgap1 gene sequence containing a SNP site, as shown in red. Putative HSF1 binding domains (p < 0.004) are shown by the green circles. Lower panel: ChIP-qPCR for the Dlgap1 SNP site after immunoprecipitation with an anti-HSF1 antibody. The βmaj (β globin, Hbb-b1) promoter region was used as negative control. Mann-Whitney test: p = 0.02 (n = 4, two batches of cell lysates per cell line, and two qPCR/batch). (D) Western blot for HSF1 and GKAP in βTC-B6 cells. Expression levels were normalized to GAPDH and small interfering RNA (siRNA) control (n = 3 independent experiments). (E) In vitro invasion assay of βTC-B6 and βTC-C3H cells, under either static or flow conditions. Two-way ANOVA, Bonferroni multiple comparisons test: n.s, not significant; ∗∗∗p < 0.001 (n = 4 independent assays for static condition; n = 6–9 for flow condition). (F) Glutamate secretion by βTC-B6 and βTC-C3H cells under static and flow conditions, sampled from invasion assays. Two-way ANOVA, Bonferroni multiple comparisons test: ∗∗∗p < 0.001; ∗∗∗∗p < 0.0001; n.s., not significant (n = 3 invasion assay devices/condition/cell line). All bar graphs represent the mean ± SEM. See also Figure S1.
Figure 2
Figure 2
Intracellular Calcium Responses and Electrophysiology Reveals Functional NMDAR in βTC-B6 but Not in βTC-C3H Cells (A) Oregon Green-labeled calcium indicator BAPTA-AM was applied to βTC-B6 and βTC-C3H cancer cells bathed in a Mg-free Ringer solution; puffing an NMDA solution (1 mM, 1 s, through perfusion pipette at left) induced calcium influx into the cells, thereby producing an increased fluorescence signal (ΔF) compared with the background fluorescence signal (F). The top left image shows βTC-B6 in phase-contrast, whereas the lower left image shows a green-fluorescence signal overlaid with a phase-contrast image. The graph at the right shows time-resolved fluorescence signals (sampling frequency/frame rate = 12.5 Hz), where each trace represents one recorded cell. The y axis indicates the change in fluorescence intensity. (B) Using the fluorescence reporter assay in (A), the number of βTC cells with active NMDAR signaling was determined following puff application of 1 mM NMDA. The ΔF/F measurements refer to the normalized difference in each cell's signal measured immediately before the application of agonist compared with the peak of the response after the puff. For βTC-B6, 263 cells from 15 different regions of three independent culture dishes were recorded. Light green bar indicates cells with no response; dark green bars indicate cells with ΔF. For βTC-C3H, 155 cells from eight regions of two different dishes were analyzed. Wilcoxon rank-sum test, p < 4.24e−16. (C) Left: exogenous application of 1 mM NMDA to βTC-B6 cells, using a puffer pipette pressure application during the period shown by gray bar. (Low-noise whole-cell recording, holding at −90 mV.) Right: exogenous application of 500 μM NMDA (two cells), 1 mM NMDA (seven cells), or glutamate (50 μM, four cells) to βTC-C3H cells. (D) L-Glutamate application to βTC-B6 cancer cells. Three successive membrane current responses (in voltage-clamp mode) are shown, using Mg-free Ringer solution, with a membrane potential of −80 mV (upper panel); voltage-response, including action potentials, was measured in current-clamp (i.e., voltage recording) mode (lower panel). (E) Intracellular glutamate perfusion during low-noise whole-cell recordings to assess autocrine activation of NMDARs in βTC cells. Left: βTC-B6 cells, n = 12 cells. A segment at higher time resolution is shown at bottom, as indicated. Right: βTC-C3H cells, n = 9 cells. (a–c) Representative segments of recording from one of three different cells. (F) Current amplitude histogram of autocrine-activated NMDARs in a βTC-B6 cell, showing peaks corresponding with single and double openings of channels (indicated by arrows) with a chord conductance of 48 pS, assuming reversal at 0 mV. (G) Current-clamp recordings with step current injection in βTC-B6 (left) and βTC-C3H (right).
Figure 3
Figure 3
High GKAP Expression Is Associated with Increased NMDAR Pathway Activity In Vivo (A) qRT-PCR evaluation for the NMDAR subunits GluN1 (Grin1), GluN2b (Grin2b), and the scaffold protein GKAP (Dlgap1) in PanNET tumors from the two genetic backgrounds. Mean ± SEM. Mann-Whitney test was used to compare the expression of each gene in the B6 and C3H tumors. p = 0.0175 (qRT-PCR: n = 7 tumors/7 mice/background). (B) Western blot of GluN2b and GKAP in PanNETs from B6 and C3H backgrounds. After normalization, the one-column t test was used for comparison, hypothetical value = 1; p = 0.01; n.s., not significant (mean ± SEM; n = 4 tumors/4 mice). (C) Immunohistochemistry (IHC) analysis of large T oncoprotein, GluN2b, and p-GluN2b in PanNET tumor tissue sections. Images are representative of >50 tumors from >10 RIP1Tag2 mice/background. S, spleen; LN, lymph node. (D) MK801 treatment in RIP1Tag2 mice. Cohorts of seven to nine mice were used for control (saline treated) and MK801 treatment in each genetic background; mean ± SEM. Mann-Whitney test: ∗∗p < 0.01; n.s., not significant.
Figure 4
Figure 4
GKAP Regulates Cancer Cell Invasion through NMDAR Activity and Downstream Effectors FMRP and HSF1 (A) Western blot for GKAP and p-GluN2b in control and GKAP-knockdown βTC-3 cells under unstimulated cell culture conditions. The numbers below indicate levels of p-GluN2b and GKAP normalized to untransfected βTC-3. (B) Fluorescence reporter assay was performed in βTC-3 small hairpin RNA (shRNA) control and GKAP-knockdown (KD) cells lines, comparing calcium transients induced by puffing an NMDA solution onto the cells. Clusters of cultured control βTC-3 cells or GKAP-KD βTC-3 cells were analyzed under a bright-field microscope after an NMDA solution (1 mM, 1 s) was puffed through perfusion pipette at left (upper panels). The arrows indicate the direction of puffing. βTC-3 shRNA control KD cells: 78 of 284 cells examined showed a response (orange bars). βTC-3 shRNA-GKAP KD cells: 5 of 178 cells showed minor NMDA responses (light blue bars). p < 10−11, Wilcoxon rank-sum test. Histogram of transient amplitude, denoting time-resolved fluorescence signals (sampling frequency/frame rate = 12.5 Hz). Light orange bar and blue bar indicate cells with no response. (C) Invasion assay in control and GKAP-KD βTC-3 cells. Two-way ANOVA, Bonferroni multiple comparisons test: ∗∗p < 0.01; n.s., not significant (mean ± SEM, n = 3 invasion assay devices/condition in one experiment; two independent experiments were performed with consistent results). (D) IHC staining of FMRP in B6 PanNETs. Similarly sized invasive versus non-invasive primary tumors on the same section were used for comparison (tumor borders marked by yellow dashed line in the representative images). Rare, multiple metastatic lesions in the liver from one mouse (indicated by the red arrowheads, tumor borders marked by yellow dashed line). Images shown are representative of an analysis of >50 PanNETs from >10 B6 RIP1Tag2 mice, one section per mouse, and all staining was performed in the same experiment. Magnified lesion is representative of >100 metastases from one liver. (E) Western blot shows the efficiency of FMRP knockdown in βTC-3 cells. The numbers below indicate levels of FMRP normalized to GAPDH. Bar graph: invasion assay. Unpaired t test: p < 0.05; ∗∗p < 0.01. FMRP #1 and #2 indicate two different siRNA constructs used (mean ± SD, n = 3 invasion assay devices per condition in one experiment; two independent experiments). (F) Western blots comparing FMRP and p-HSF1 expression in βTC-3 cancer cells infected with control shRNA or shRNA-GKAP lentiviral vectors (left), and comparing expression of p-GluN2b, FMRP, and p-HSF1 in βTC-3 cancer cells treated with either vehicle or MK801 (right). GAPDH was used as a loading control and the numbers below indicate levels of p-GluN2b, FMRP, and p-HSF1 normalized to GAPDH. (n = 3). (G) Left: tissue immunostaining shows expression of total and active GluN2b, FMRP, and total and active HSF1 in tumors from saline- and MK801-treated B6 RIP1Tag2 mice. Data shown are representative of 9–21 random pictures from >15 PanNETs from three mice per group. Scale bar in the blow-up picture represents 25 μm. Right: quantification of FMRP and pHSF1 expression in saline- and MK801-treated tumors. Mean ± SEM. FMRP, n = 9 pictures in saline treated groups, n = 21 in MK801-treated group; p-HSF1, n = 15 pictures in saline treated groups, n = 20 in MK801-treated group. Mann-Whitney test: p < 0.05; ∗∗p < 0.01. See also Figure S2.
Figure 5
Figure 5
NMDAR Signaling through GKAP Promotes Invasion in Both Mouse and Human PDAC Cell Lines (A) Left panels: western blot analysis of GKAP and p-GluN2b levels in mPDAC-4361 and mPDAC-2263 cell lines. The numbers indicate quantification (n = 3). Right panel: invasion assay in static and flow-stimulated conditions. Two-way ANOVA, Bonferroni's multiple comparisons test (right panel): ∗∗∗∗p < 0.0001 (mean ± SEM, n = 3 invasion assay devices per condition per cell line in one experiment; two independent experiments). (B) MK801 treatment of mPDAC cell lines in static and flow-stimulated invasion assays. The data were normalized to each corresponding “control” in the same static/flow conditions. Two-way ANOVA, Bonferroni's multiple comparisons test: n.s., not significant; p < 0.05 (mean ± SEM, n = 3 invasion assay devices per condition per cell line in one experiment; two independent experiments). (C and D) GKAP mRNA was knocked-down in mPDAC-4361 (C) and in two hPDAC cell lines, DanG and SUIT2 (D). The knockdown efficiency was assessed by western blot analysis; numbers below indicate levels of GKAP normalized to GAPDH. Cell invasiveness in the invasion assays is shown in bar graphs. Representative images of DAPI-stained nuclei from the invasion assay illustrate the cells that reached the other side of the membrane of a Boyden chamber (scale bar, 100 μm) (C). Two-way ANOVA, Bonferroni's multiple comparisons test (C) or unpaired t test (D): p < 0.05; ∗∗p < 0.01; ∗∗∗p < 0.001; ∗∗∗∗p < 0.0001. For all invasion assays: n = 3 invasion assay devices per condition in one experiment. Mean ± SEM. Two independent experiments. (E) Western blot analysis of p-HSF1 and FMRP levels in control and MK801-treated hPDAC cells. The numbers below indicate levels of p-HSF1 and FMRP normalized to GAPDH (n = 3). (F) Western blot analysis assessing siRNA-mediated HSF1 and FMRP knockdown in DanG cells and SUIT2 cells are shown in the left panels. The numbers below indicate levels of HSF1 and FMRP normalized to GAPDH. Flow-guided-invasion assays of hPDAC cells after HSF1 or FMRP knockdown are shown in bar graphs on the right). Mean ± SEM, unpaired t test: p < 0.05; ∗∗p < 0.01 (n = 3 invasion assay devices/condition in one experiment). Two independent experiments were performed with consistent results.
Figure 6
Figure 6
The NMDAR/GKAP/FMRP/HSF1 Signaling Axis Is Active in PDAC Tumors (A) IHC staining of GKAP, FMRP, and HSF1 in both primary tumors (upper panels) and liver metastases (lower panels) from a PDAC GEMM. The primary tumor panels are representative of >5 tumor fields per pancreas from >20 mice. The liver metastasis panels are representative of two liver macro-metastases (∼1 cm in diameter). (B) IHC staining of p-GluN2b, GKAP, FMRP, and HSF1 in hPDAC tumors displayed in a tissue microarray. Lower table: quantification of immunostaining (percentage) in each tissue section. Wilcoxon rank-sum test. (C) Correlation between GKAP, FMRP, HSF1, and tumor size with p-GluN2b. Spearman's correlation coefficient. (D) Correlation between vascular invasion by cancer cells, classified as absent (V0) or present (V1) with p-GluN2b. Wilcoxon rank-sum test.
Figure 7
Figure 7
Identification of Gene Expression Signatures for mPanNETs (A) Schematic presentation for gene expression signatures associated with tumor phenotypes. Red and blue boxes mark the samples used in the signature analysis; red suggests enrichment of the gene expression signature, while blue suggests depletion. (B) Mouse strain signature. The heatmap shows major drivers of the strain signature (fold change >2; |Z| > 9) and the boxplot illustrates the standardized signature scores of sample groups. The box marks the 25th to 75th percentiles, and the whiskers show minimum to maximum. The line in the middle of the box indicates the median. No data point is beyond the limit of lines. Genes with |Z| > 9 in the signature are shown. Red, upregulated in B6; blue, upregulated in C3H. (C) MK801 treatment signature. The heatmap shows the 330 MK801 treatment signature genes, which segregated MK801-treated B6 tumor samples from B6 control tumors, and the boxplot illustrates the standardized signature scores of sample groups. The box marks the 25th to 75th percentiles, and the whiskers show minimum to maximum. The line in the middle of the box indicates the median. No data point is beyond the limit of lines. Genes with |Z| > 9 in the signature are shown. Red, upregulated in MK801-treated B6 tumors; blue, upregulated in B6 control tumors. (D) GSEA analysis revealed that the MK801 treatment signature showed high enrichment when compared with the strain signature. p = 0 for both up- and downregulated gene sets. (E) Leading edge analysis from (D) identified 148 common driver genes in both MK801 treatment signature and mouse strain signature, representing NMDAR-pathwaylow signature. Shown here are the “core” common driver genes, which have |Z| > 3 in both signatures. Red, upregulated in MK801-treated B6 tumors and C3H tumors; blue, upregulated in B6 controls. See also Figure S3, Tables S1, S2, S3, and S4.
Figure 8
Figure 8
Activity of the NMDAR Signaling Pathway is Associated with Poor Prognosis in Human Cancer Types as Assessed in the TCGA Patient Cohort (A) MK801 (left panel) and memantine (right panel) treatments in PDAC GEMM. (Left) Control group: 28 mice; median survival, 23 days after enrollment. MK801 group: 25 mice; median survival, 36 days after enrollment. p = 0.0206, log rank test. (Right) Control group: 35 mice; median survival, 13.4 weeks. Memantine group, 33 mice; median survival, 15.4 weeks. Log rank test, p < 0.05. (B) Survival analysis employing the mPanNET MK801 treatment signature in PDAC patients (n = 13 for associated, n = 165 for not associated). Kaplan-Meier analysis with log rank p value shown. (C) Cox regression analysis in PDAC patients, both in univariate and multivariable analyses while controlling for other clinical covariates. HR, hazard ratio; CI, confidence interval; T score, primary tumor size/invasiveness; N score, lymph node metastasis; Pinteraction, p value of interaction between significant covariates (model comparison; likelihood ratio test). (D) Survival analysis employing MK801 treatment signature in patients from several cancer types in addition to PDAC, including glioma (combining low-grade glioma and glioblastoma) and kidney cancers (combining three major subtypes of kidney cancer: chromophobe renal cell carcinoma, clear cell renal carcinoma, and papillary kidney carcinoma). All patients were included in each cancer type shown, regardless of treatment and staging. Brain cancer, associated, n = 566; not associated, n = 93. Kidney cancers, associated, n = 684; not associated, n = 197. (E) Empirical cumulative distribution function (CDF) plot demonstrating the association of low-grade gliomas (LGG; marked in blue) compared with high-grade glioblastomas (GBM; marked in red) with the (pathway-low) MK801-treatment signature (p < 2.22e-16; Kolmogorov-Smirnov test). (F) Survival analysis employing NMDAR-pathwaylow signature in PDAC patients (n = 13 for associated, n = 164 for not associated). Kaplan-Meier analysis with log rank p value shown. (G) Survival analysis employing the NMDAR-pathwaylow signature in patients from several cancer types. All patients were included in each cancer type shown, regardless of treatment and staging. Brain cancer, associated, n = 572; not associated, n = 88. Kidney cancers, associated, n = 501; not associated, n = 378. Uveal melanoma, associated, n = 55; not associated, n = 25. See also Figure S4.

References

    1. Abbott L.F., Nelson S.B. Synaptic plasticity: taming the beast. Nat. Neurosci. 2000;3(Suppl):1178–1183. - PubMed
    1. Ascano M., Jr., Mukherjee N., Bandaru P., Miller J.B., Nusbaum J.D., Corcoran D.L., Langlois C., Munschauer M., Dewell S., Hafner M. FMRP targets distinct mRNA sequence elements to regulate protein expression. Nature. 2012;492:382–386. - PMC - PubMed
    1. Barbie D.A., Tamayo P., Boehm J.S., Kim S.Y., Moody S.E., Dunn I.F., Schinzel A.C., Sandy P., Meylan E., Scholl C. Systematic RNA interference reveals that oncogenic KRAS-driven cancers require TBK1. Nature. 2009;462:108–112. - PMC - PubMed
    1. Biton, A., Zinovyev, A., Barillot, E., and Radvanyi, F. (2013). MineICA: independent component analysis of transcriptomic data. https://www.bioconductor.org/packages/devel/bioc/vignettes/MineICA/inst/...
    1. Bostrom C.A., Majaess N.M., Morch K., White E., Eadie B.D., Christie B.R. Rescue of NMDAR-dependent synaptic plasticity in Fmr1 knock-out mice. Cereb. Cortex. 2015;25:271–279. - PubMed

Publication types

MeSH terms

Substances