. 2018 Apr 5;70(1):60-71.e15.
doi: 10.1016/j.molcel.2018.02.026. Epub 2018 Mar 29.

Structural Basis of Transcription Inhibition by Fidaxomicin (Lipiarmycin A3)

Affiliations

Structural Basis of Transcription Inhibition by Fidaxomicin (Lipiarmycin A3)

Wei Lin et al. Mol Cell. .

Abstract

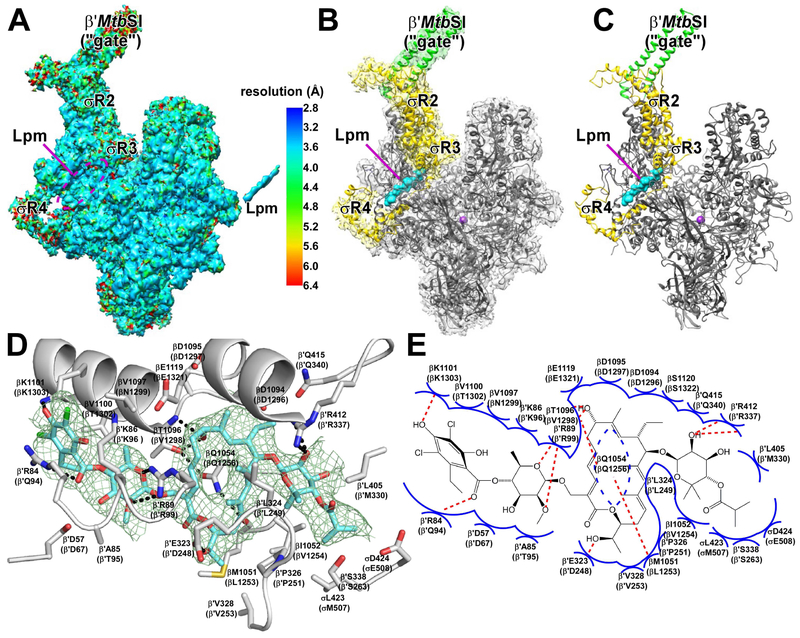
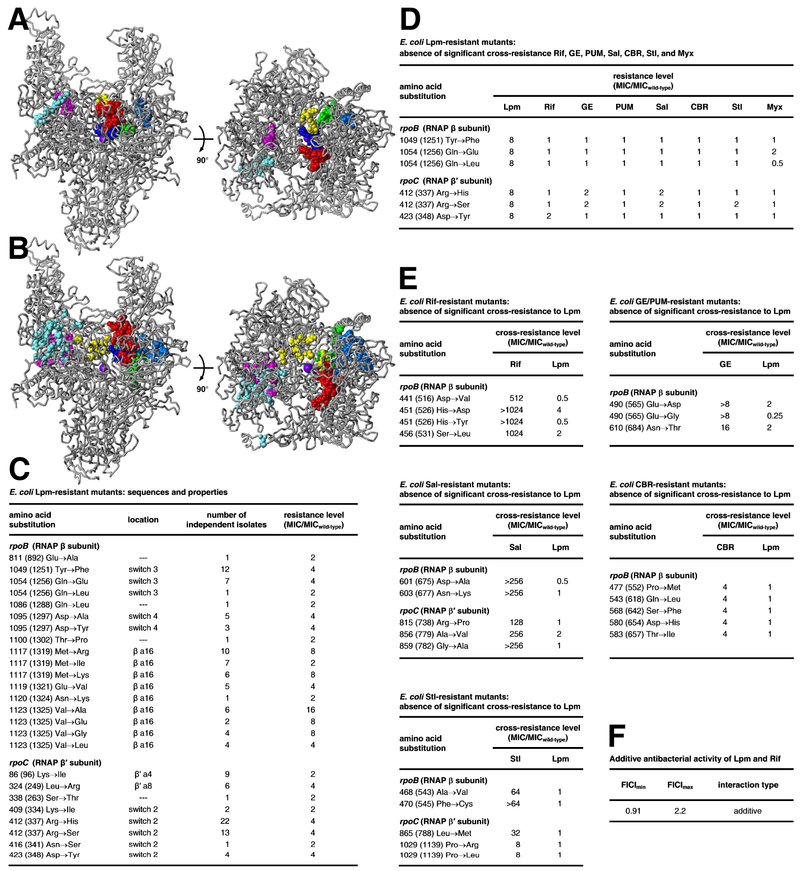
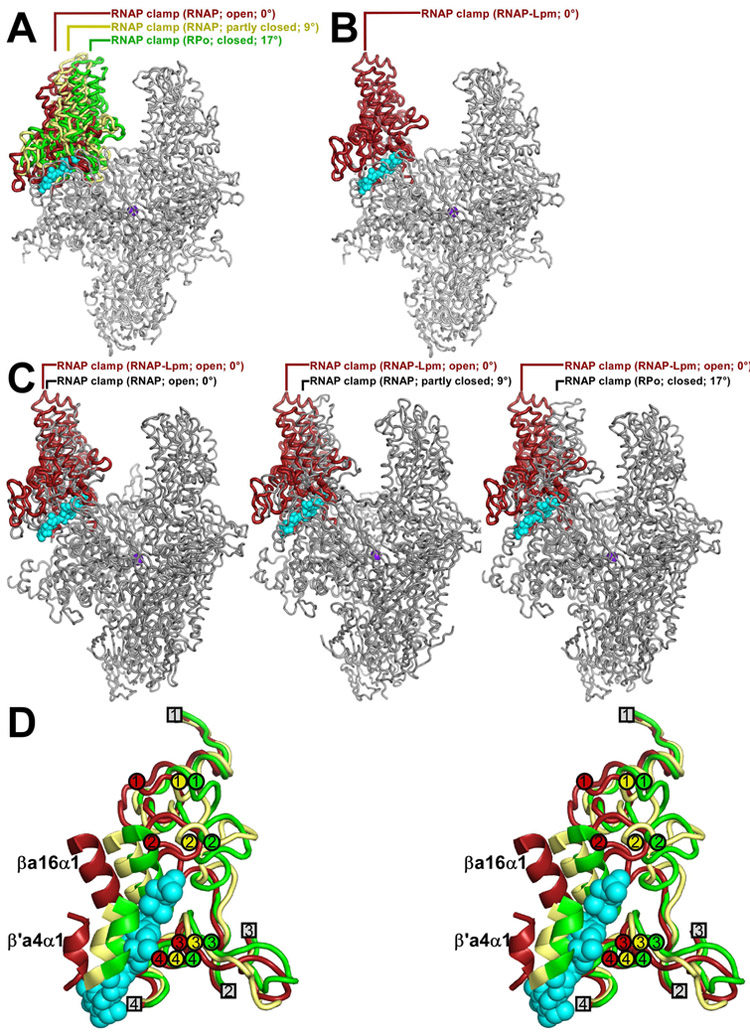
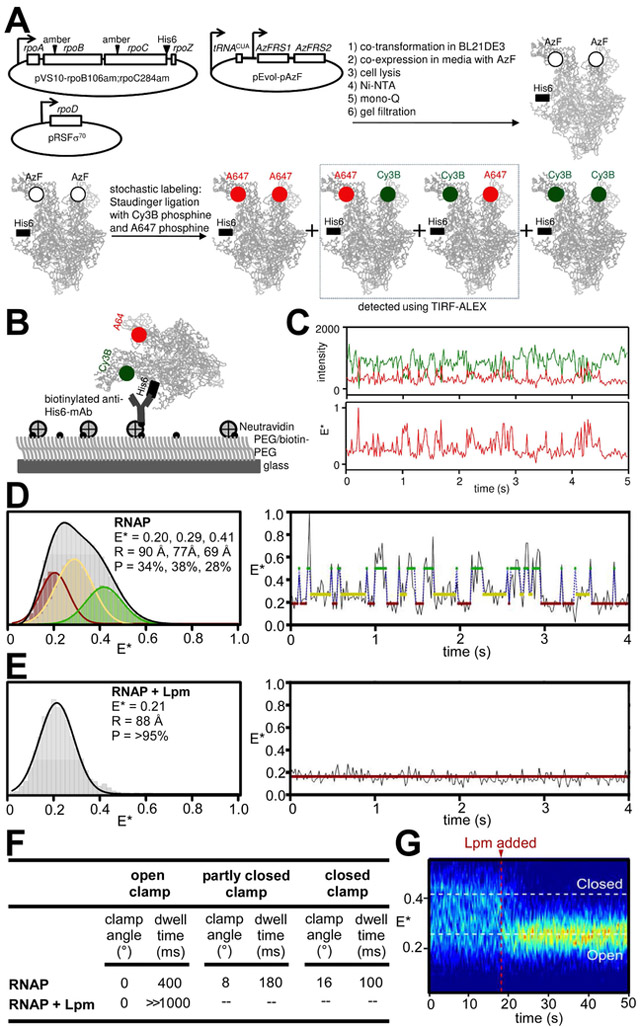
Fidaxomicin is an antibacterial drug in clinical use for treatment of Clostridium difficile diarrhea. The active ingredient of fidaxomicin, lipiarmycin A3 (Lpm), functions by inhibiting bacterial RNA polymerase (RNAP). Here we report a cryo-EM structure of Mycobacterium tuberculosis RNAP holoenzyme in complex with Lpm at 3.5-Å resolution. The structure shows that Lpm binds at the base of the RNAP "clamp." The structure exhibits an open conformation of the RNAP clamp, suggesting that Lpm traps an open-clamp state. Single-molecule fluorescence resonance energy transfer experiments confirm that Lpm traps an open-clamp state and define effects of Lpm on clamp dynamics. We suggest that Lpm inhibits transcription by trapping an open-clamp state, preventing simultaneous interaction with promoter -10 and -35 elements. The results account for the absence of cross-resistance between Lpm and other RNAP inhibitors, account for structure-activity relationships of Lpm derivatives, and enable structure-based design of improved Lpm derivatives.

Keywords: Mycobacterium tuberculosis; RNA polymerase; RNA polymerase clamp; RNA polymerase inhibitor; RNA polymerase switch region; antibiotic; cryo-electron microscopy; fidaxomicin; lipiarmycin; single-molecule fluorescence resonance energy transfer.


Figures

Figure 1.
Figure 1.. Structure of Mtb RNAP-Lpm
A, Density map for Mtb RNAP-Lpm (left) and Lpm (right), colored by local resolution. B, Density and atomic model for Mtb RNAP-Lpm. Gray, RNAP core other than β′MtbSI; green, β′MtbSI; yellow, σ; green mesh, density map for Lpm; cyan, Lpm; violet sphere, RNAP active-center Mg2+. C, Atomic model for Mtb RNAP-Lpm. Colors as in B. D, RNAP-Lpm interactions (residues numbered as in Mtb RNAP and, in parentheses, as in Escherichia coli RNAP). Gray ribbons, RNAP backbone; gray sticks, RNAP carbon atoms; cyan sticks, Lpm carbon atoms; red, blue, and green sticks, oxygen, nitrogen, and chlorine atoms; dashed lines, H-bonds. E, Summary of RNAP-Lpm interactions. Blue arcs, van der Waals interactions; red dashed lines, H-bonds. See also Figs. S1-S4.
Figure 2.
Figure 2.. Relationship between binding site and resistance determinant of Lpm and binding sites and resistant determinants of other RNAP inhibitors
A, Binding positions of Lpm (cyan; Fig. 1), Rif and Sor (red; PDB: 1I6V, PDB: 1YNJ, PDB: 2A68, PDB: 2A69, PDB: 4KN4, PDB: 4KN7, PDB: 4OIR, and PDB: 5UHB), GE and PUM (dark blue; PDB: 4OIN, PDB: 4OIR, and PDB: 5X21), CBR and AAP (light blue; PDB: 4XSY, PDB: 4XSZ, PDB: 4ZH2, PDB: PDB: 4ZH3, PDB: 4ZH4, PDB: 5UHE, and PDB: 5UHF), Sal (green; PDB: 4MEX), Stl (yellow; PDB: 1ZYR), and Myx and SQ (magenta; PDB: 3DXJ, PDB: 3EQL, PDB: 4YFK, PDB: 4YFN, and PDB: 4YFX), mapped onto structure of Mtb RNAP (gray; two orthogonal views; β′MtbSI and σ omitted for clarity). Violet sphere, RNAP active-center Mg2+. B, Resistance determinants of Lpm (cyan; Fig. 2C), Rif and Sor (red; Campbell et al., 2001, 2005), GE and PUM (dark blue; Zhang et al., 2014; Maffioli et al., 2017), CBR703 and AAP (light blue; Lin et al., 2017; Feng et al., 2015; Bae et al., 2015), Sal (green; Degen et al., 2014), Stl (yellow; Tuske et al., 2005; Temiakov et al., 2005), and Myx, Cor, Rip, and SQ (magenta; Mukhopadhyay et al., 2008; Belogurov et al., 2009; Molodtsov et al., 2015) mapped onto structure of Mtb RNAP. C, Sequences and properties of E. coli Lpm-resistant mutants residues numbered as in Mtb RNAP and, in parentheses, as in Escherichia coli RNAP). D, Absence of significant cross-resistance of E. coli Lpm-resistant mutants to Rif, GE, PUM, Sal, CBR, Stl, and Myx. E, Absence of significant cross-resistance of E. coli Rif-, GE/PUM-, Sal-, CBR-, and Stl-resistant mutants to Lpm. F, Additive antibacterial activity of Lpm and Rif. [Resistance and cross-resistance levels for Lpm-, CBR-, and Stl-resistant mutants are from strains having the mutant RNAP subunit gene on a plasmid and the corresponding wild-type RNAP subunit gene on the chromosome (merodiploid strains; see Methods). Resistance and cross-resistance levels for Lpm-, CBR-, and Stl-resistant mutants are from strains having the mutant RNAP subunit gene on the chromosome and no corresponding wild-type RNAP subunit gene (non-merodipoid strains; see Methods). Resistance and cross-resistance levels are expected to be lower for merodiploid strains than for non-merodiploid strains.] See also Fig. S5.
Figure 3.
Figure 3.. Effects of Lpm on RNAP clamp conformation: cryo-EM data
A, RNAP open (red), partly closed (yellow), and closed (green) clamp conformational states. Mtb RNAP-Lpm main mass (view as in Figs. 1-2) and, superimposed, RNAP clamps from crystal structures of T. thermophilus RNAP in different crystal lattices [T. thermophilus RNAP with open clamp (red; structure determined in this work to enable comparison of open-clamp, partly-closed-clamp, and closed-clamp states of RNAP from a single bacterial species; Table 2), T. thermophilus RNAP with partly open clamp (yellow; PDB: 5TMC), and T. thermophilus RPo (green; PDB: 4G7H)]. B, RNAP open-clamp state in Mtb RNAP-Lpm. Red, clamp in Mtb RNAP-Lpm. Other colors as in A. C, Comparisons of RNAP clamp conformation in Mtb RNAP-Lpm to RNAP clamp conformations in crystal structures of Tth RNAP with open clamp (left; Table 2), Tth RNAP with partly closed clamp (center; PDB: 5TMC), and Tth RPo with closed clamp (right; PDB: 4G7H). Each image shows Mtb RNAP-Lpm (clamp in red; view orientation and other colors as in Figs. 1-2) and, superimposed, the RNAP clamp of the comparator structure (gray). D, Stereodiagram of Lpm binding site showing conformations of RNAP structural elements SW1, SW2, SW3, SW4, βa16α1, and β'a4α1, in open-clamp (red; Mtb RNAP-Lpm), partly-closed clamp (yellow; PDB: 5TMC), and closed-clamp (green; PDB: 4G7H) states. RNAP switches. SW1, SW2, SW3, and SW4 are shown with ends that connect to the RNAP clamp as numbered circles, and ends that connect to the RNAP main mass as numbered squares. Cyan, Lpm.
Figure 4.
Figure 4.. Effects of Lpm on RNAP clamp conformation: single-molecule FRET data
A, Use of unnatural-amino-acid mutagenesis, Staudinger ligation with Cy3B-phosphine and Alexa647-phosphine, and total-internal-reflection fluorescence microscopy with alternating-laser excitation microscopy (TIRF-ALEX) to obtain FRET data for single molecules of RNAP having fluorescent probes at the tips of the walls of the RNAP active-center cleft (see STAR Methods). Green, fluorescence donor probe Cy3B; red, fluorescent acceptor probe Alexa647; black square, hexahistidine tag. B, Surface-immobilization of fluorescent-probe-labelled RNAP for TIRF-ALEX. C, Time trace of donor emission intensity (green) and acceptor emission intensity (red) (top) and corresponding time trace of donor-acceptor FRET efficiency (bottom). D, Single-molecule FRET data for RNAP holoenzyme in absence of Lpm. Left, histogram. Gray, all states; colors, Hidden Markov Model (HMM)-assigned open, partly closed, and closed states (red, yellow, and green). Right, time trace with HMM-assigned open, partly closed, and closed states (red, yellow, and green). E, Single-molecule FRET data for RNAP holoenzyme in presence of Lpm (histogram and time trace as in D). F, Summary of RNAP clamp angles and dwell times for open, partly closed, and closed clamp states in absence and presence of Lpm. G, Time trace for RNAP holoenzyme before and after addition of Lpm.
Figure 5.
Figure 5.. Mechanism of transcription inhibition by Lpm
A, RNAP holoenzyme (left), RPc (center; DNA as in Ruff et al., 2015), and RPo (right, DNA as in Zuo and Steitz, 2015; Bae et al., 2015; Feng et al., 2016) for RNAP in absence of Lpm (closed clamp). σR2 and σR4 simultaneously engage promoter −10 and −35 elements in RPc and RPo. Atomic coordinates from PDB: 5UH5. Green ribbons, σ; green surface, σR2 NT-11 pocket; yellow surfaces, σR2 Trp wedge and σR4 recognition helix; blue, DNA. Other colors as in Figs. 1-2. B, As A, but for RNAP in presence of Lpm (open clamp). σR2 and σR4 cannot simultaneously engage promoter −10 and −35 elements in RPc and RPo. Brown ribbons, σ; brown surface, σR2 NT-11 pocket; pink surface, σR2 Trp wedge and σR4 recognition helix; cyan, Lpm. Other colors as in A.

References

    1. Adams P, Afonine P, Bunkóczi G, Chen V, Davis I, Echols N, Headd J, Hung L, Kapral G, Grosse-Kunstleve R, McCoy A, Moriarty N, Oeffner R, Read R, Richardson D, Richardson J, Terwilliger T, and Zwart P (2010). PHENIX: a comprehensive Python-based system for macromolecular structure solution. Acta Cryst, D 66, 213. - PMC - PubMed
    1. Arnone A, Nasini G, and Cavalleri B (1987). Structure elucidation of the macrocyclic antibiotic lipiarmycin. J. Chem. Soc. Perkin Trans. I 6, 1353–1359.
    1. Artsimovitch I, Seddon J, and Sears P (2012). Fidaxomicin is an inhibitor of the initiation of bacterial RNA synthesis. Clin. Infect. Dis 55, S127–S131. - PMC - PubMed
    1. Babakhani F, Gomez A, Robert N, and Sears P (2011). Killing kinetics of fidaxomicin and its major metabolite, OP-1118, against Clostridium difficile. J. Med. Microbiol 60, 1213–1217. - PMC - PubMed
    1. Bae B, Feklistov A, Lass-Napiorkowska A, Landick R, and Darst S (2015). Structure of a bacterial RNA polymerase holoenzyme open promoter complex. eLife 4, e08504. - PMC - PubMed

Publication types

MeSH terms

LinkOut - more resources