. 2018 May 8;10(5):1596-1609.
doi: 10.1016/j.stemcr.2018.03.001. Epub 2018 Mar 29.

Heterogeneity of Human Breast Stem and Progenitor Cells as Revealed by Transcriptional Profiling

Affiliations

Heterogeneity of Human Breast Stem and Progenitor Cells as Revealed by Transcriptional Profiling

Justin A Colacino et al. Stem Cell Reports. .

Abstract

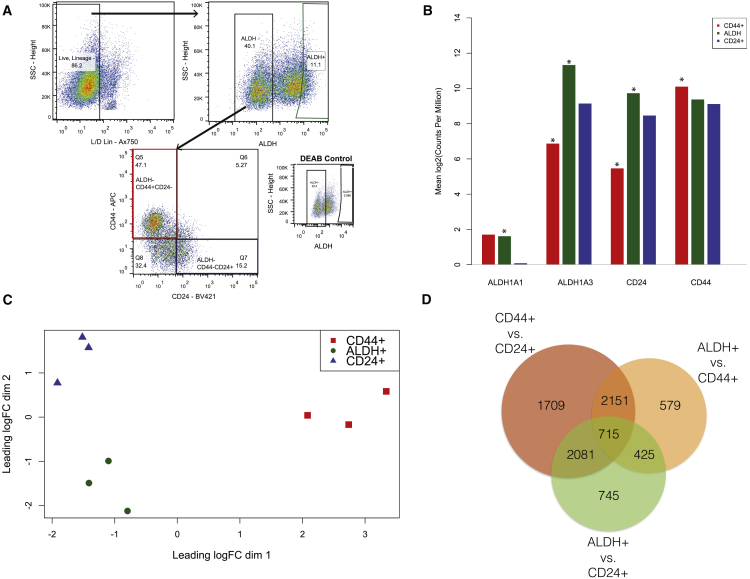
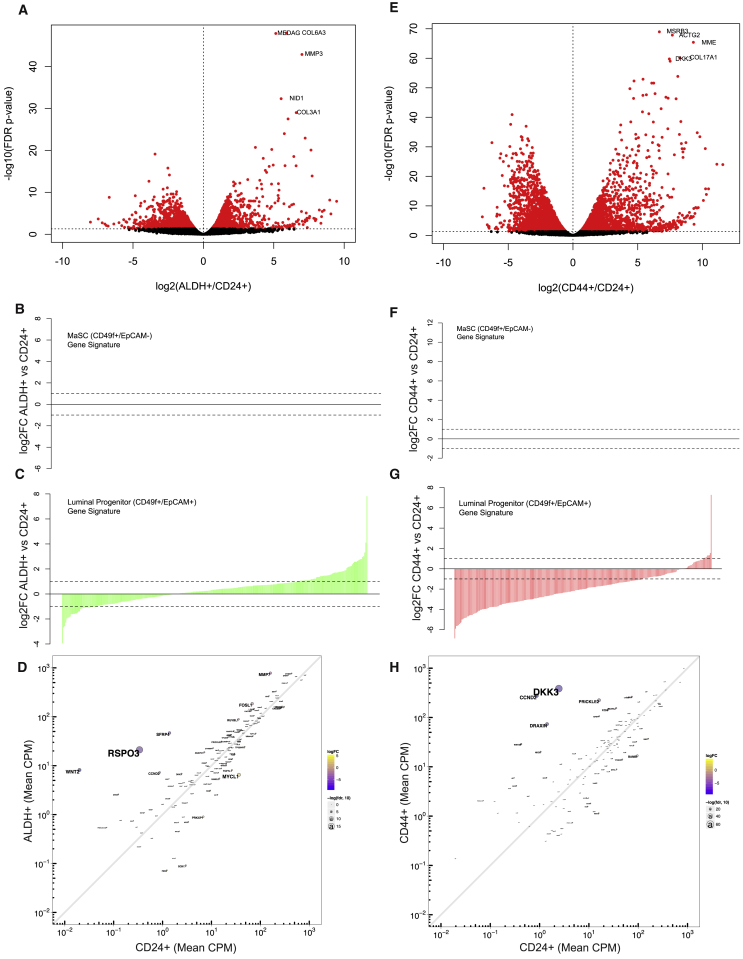
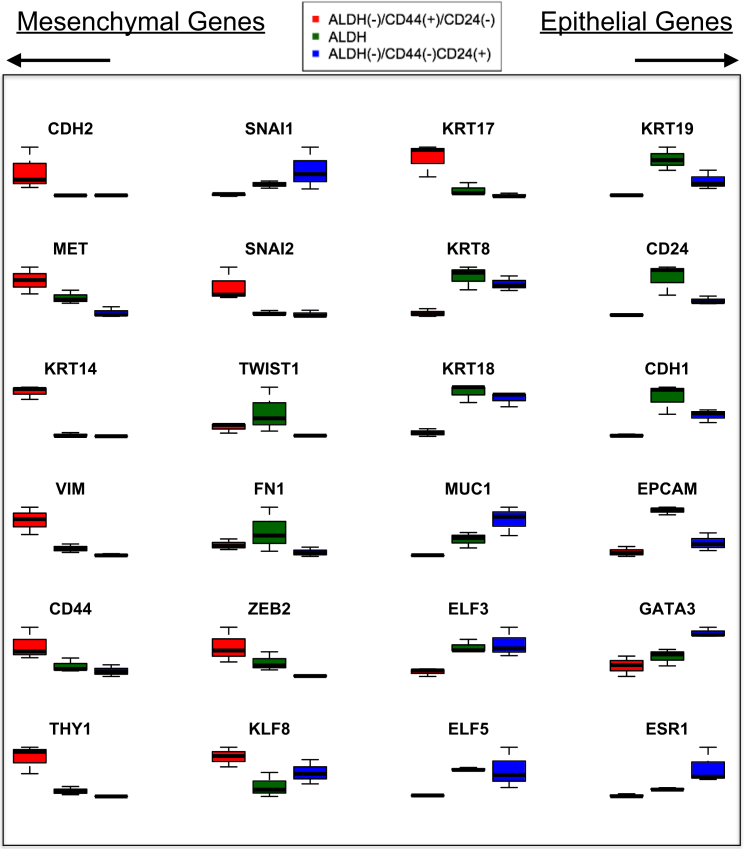
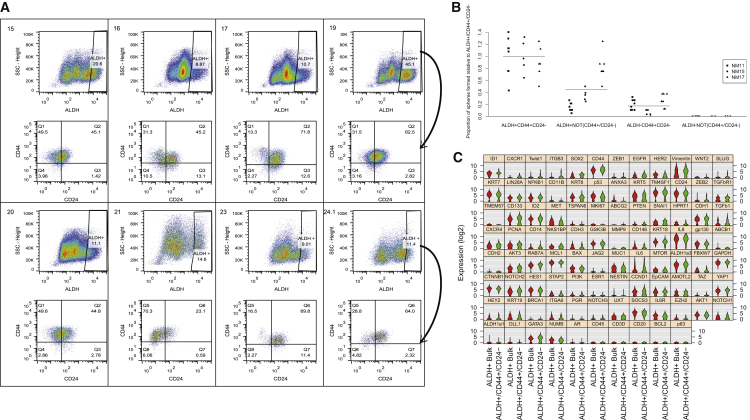
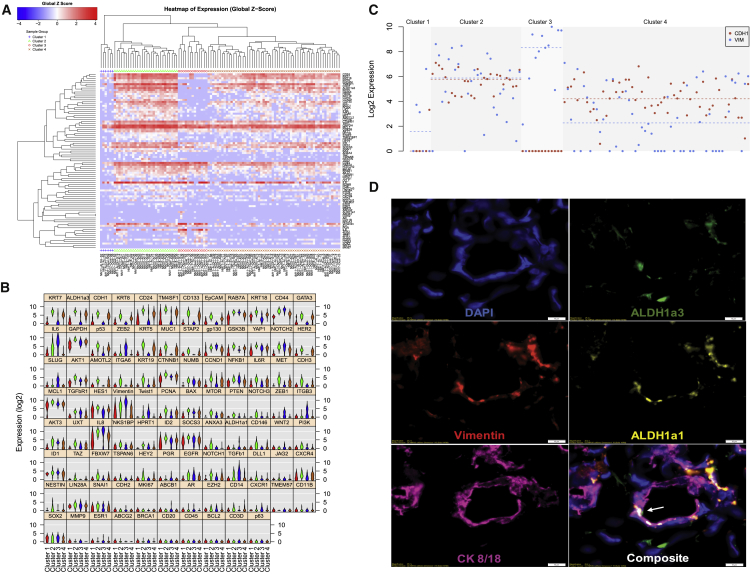
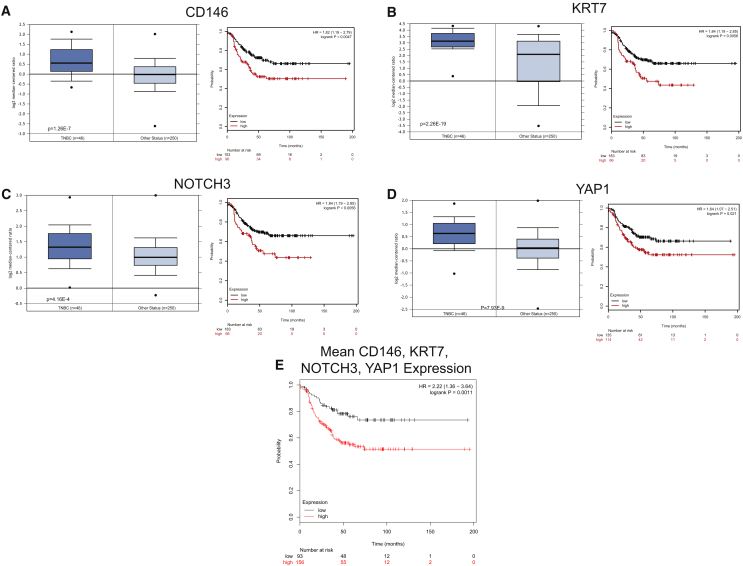
During development, the mammary gland undergoes extensive remodeling driven by stem cells. Breast cancers are also hierarchically organized and driven by cancer stem cells characterized by CD44+CD24low/- or aldehyde dehydrogenase (ALDH) expression. These markers identify mesenchymal and epithelial populations both capable of tumor initiation. Less is known about these populations in non-cancerous mammary glands. From RNA sequencing, ALDH+ and ALDH-CD44+CD24- human mammary cells have epithelial-like and mesenchymal-like characteristics, respectively, with some co-expressing ALDH+ and CD44+CD24- by flow cytometry. At the single-cell level, these cells have the greatest mammosphere-forming capacity and express high levels of stemness and epithelial-to-mesenchymal transition-associated genes including ID1, SOX2, TWIST1, and ZEB2. We further identify single ALDH+ cells with a hybrid epithelial/mesenchymal phenotype that express genes associated with aggressive triple-negative breast cancers. These results highlight single-cell analyses to characterize tissue heterogeneity, even in marker-enriched populations, and identify genes and pathways that define this heterogeneity.

Keywords: RNA-seq; breast stem cell; epithelial; hybrid; mesenchymal; single-cell RNA.


Figures

Figure 1
Figure 1
Purification and Transcriptomic Profiling of ALDH+, ALDHCD44+CD24, and ALDHCD44CD24+ Human Breast Cells (A) A representative FACS isolation diagram of the three populations of cells isolated from reduction mammoplasties. ALDH+ gating was based on the DEAB negative control. ALDHCD44+CD24 will be hereafter referred to as CD44+ and ALDHCD44CD24+ as CD24+. (B) RNA expression, from RNA-seq analysis of FACS-purified cells from three donors, of genes associated with the sorting markers. False discovery rate (FDR) p < 0.05. (C) Multidimensional scaling plot based on the 500 most variably expressed genes. (D) Overlap in differentially expressed (FDR p < 0.05) genes between the three populations.
Figure 2
Figure 2
Comparison of Gene Expression Signatures between ALDH+ and CD44+ with Non-stem Cell-Enriched CD24+ Cells (A) FDR volcano plot comparing the change in gene expression between ALDH+ and CD24+ cells from three donors, with the names of the top five most statistically different genes labeled. (B and C) Comparison of the log2 fold-change differences between ALDH+ and CD24+ and the mammary stem cell and luminal progenitor cell gene expression signature, respectively, reported in Lim et al. (2009). (D) Enrichment of Wnt signaling genes in ALDH+ relative to CD24+ cells. (E) FDR volcano plot comparing differences in gene expression between CD44+ and CD24+ cells. (F and G) Comparison of the log2 fold-change differences between CD44+ and CD24+ (F) and the mammary stem cell and luminal progenitor cell gene expression signature (G), respectively. (H) Enrichment of Wnt signaling-related genes in CD44+ relative to CD24+ cells.
Figure 3
Figure 3
Relative Expression Levels of Mesenchymal Phenotype- and Epithelial Phenotype-Associated Genes in ALDH+, CD44+, and CD24+ Cells from Three Donors
Figure 4
Figure 4
Quantitation and Profiling of Breast Cells that Express Both Stem Cell Markers ALDH+ and CD44+CD24 (A) Quantitation, by flow cytometry, of the ALDH+ cell population in mammary tissues (n = 8). ALDH+ cells were further analyzed for CD44 and CD24 expression (arrow), with the top left quadrant in each bottom panel representing ALDH+CD44+CD24 cells. (B) Mammosphere formation rates of cells expressing different combinations of ALDH and CD44/CD24 (cells sorted from n = 3 individuals: termed NM11, NM15, NM17, at least five technical replicates run per condition with results from all replicates shown), with formation rates presented relative to ALDH+CD44+CD24 cells. (C) Single-cell gene expression profiling of ALDH+CD44+CD24 and ALDH+ bulk (ALDH+ cells that do not express CD44+CD24) cells. Genes are ordered by statistical significance of difference in expression between the two populations.
Figure 5
Figure 5
Unbiased Analysis of Single-Cell Gene Expression Data from ALDH+ Breast Cells (A) Hierarchical clustering analysis of gene expression measures from a total of 105 ALDH+ cells isolated from three independent individuals reveals four expression clusters. (B) Violin plot analysis of the expression of the gene expression panel across the four clusters. (C) Comparison of expression of the epithelial gene CDH1 (red) and the mesenchymal gene VIM (blue) across the four clusters. (D) Immunofluorescence antibody staining of adjacent normal breast tissue for DAPI, ALDH1A1, ALDH1A3, CK8/18, and vimentin. Arrow identifies cell with co-expression of CK8/18, vimentin, and ALDH1A3. Scale bars, 10 μm.
Figure 6
Figure 6
Expression of Cluster 2 Genes in TNBCs and the Relationship of Expression with Survival (A–D) Expression of CD146 (A), KRT7 (B), NOTCH3 (C), and YAP1 (D) in TNBCs relative to other breast cancers as well as relative survival of patients with TNBCs that express high relative to low amounts of each gene. (E) Relative survival of TNBC patients with tumors that have high relative to low mean CD146, KRT7, NOTCH3, and YAP1 expression. HR, hazard ratio.

References

    1. Aceto N., Bardia A., Miyamoto D.T., Donaldson M.C., Wittner B.S., Spencer J.A., Yu M., Pely A., Engstrom A., Zhu H. Circulating tumor cell clusters are oligoclonal precursors of breast cancer metastasis. Cell. 2014;158:1110–1122. - PMC - PubMed
    1. Al-Hajj M., Wicha M.S., Benito-Hernandez A., Morrison S.J., Clarke M.F. Prospective identification of tumorigenic breast cancer cells. Proc. Natl. Acad. Sci. USA. 2003;100:3983–3988. - PMC - PubMed
    1. Anjanappa M., Cardoso A., Cheng L., Mohamad S., Gunawan A., Rice S., Dong Y., Li L., Sandusky G.E., Srour E.F., Nakshatri H. Individualized breast cancer characterization through single-cell analysis of tumor and adjacent normal cells. Cancer Res. 2017;77:2759–2769. - PMC - PubMed
    1. Benjamini Y., Hochberg Y. Controlling the false discovery rate: a practical and powerful approach to multiple testing. J. Roy. Stat. Soc. B. 1995;57:289–300.
    1. Bidarra S.J., Oliveira P., Rocha S., Saraiva D.P., Oliveira C., Barrias C.C. A 3D in vitro model to explore the inter-conversion between epithelial and mesenchymal states during EMT and its reversion. Sci. Rep. 2016;6:27072. - PMC - PubMed

Publication types