. 2018 Apr:30:261-272.
doi: 10.1016/j.ebiom.2018.03.028. Epub 2018 Mar 27.

Trans-Fats Inhibit Autophagy Induced by Saturated Fatty Acids

Affiliations

Trans-Fats Inhibit Autophagy Induced by Saturated Fatty Acids

Allan Sauvat et al. EBioMedicine. 2018 Apr.

Abstract

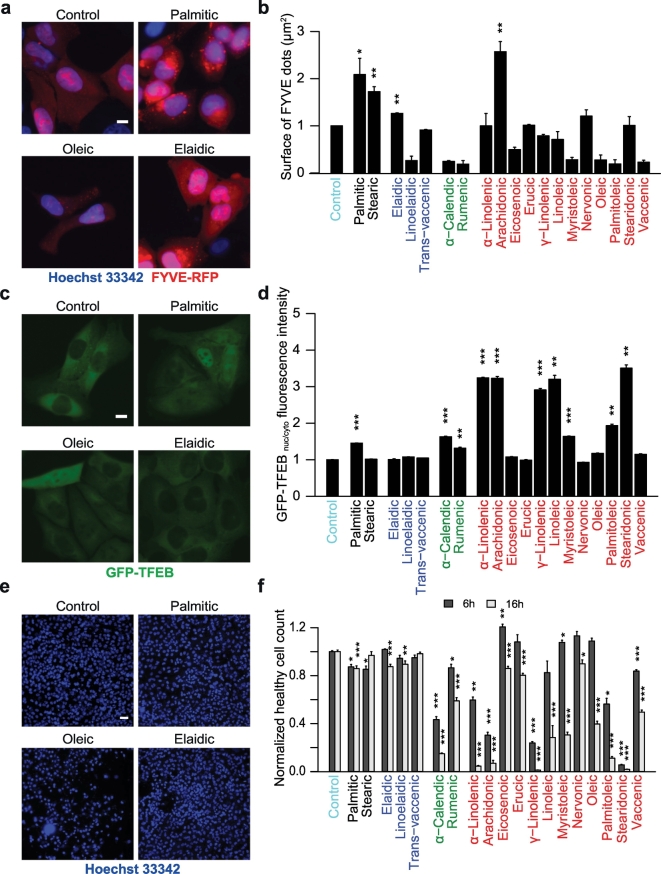
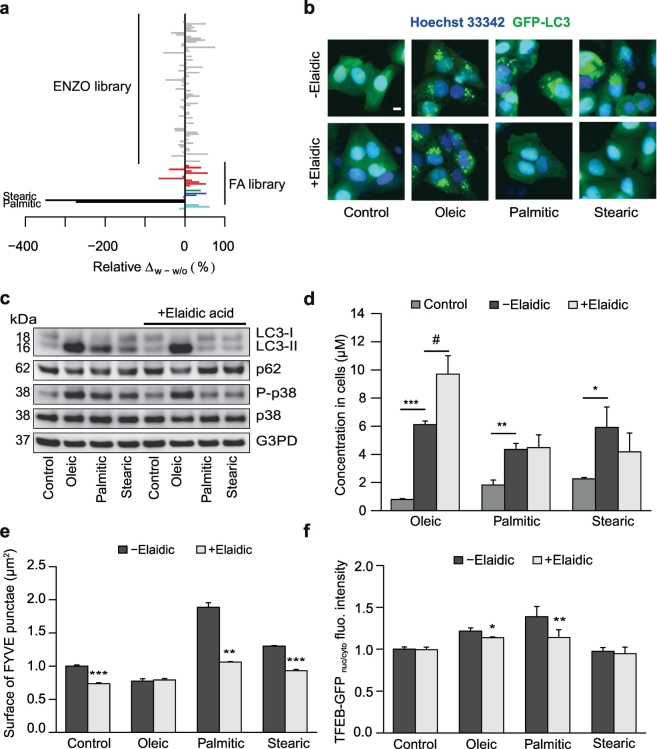
Depending on the length of their carbon backbone and their saturation status, natural fatty acids have rather distinct biological effects. Thus, longevity of model organisms is increased by extra supply of the most abundant natural cis-unsaturated fatty acid, oleic acid, but not by that of the most abundant saturated fatty acid, palmitic acid. Here, we systematically compared the capacity of different saturated, cis-unsaturated and alien (industrial or ruminant) trans-unsaturated fatty acids to provoke cellular stress in vitro, on cultured human cells expressing a battery of distinct biosensors that detect signs of autophagy, Golgi stress and the unfolded protein response. In contrast to cis-unsaturated fatty acids, trans-unsaturated fatty acids failed to stimulate signs of autophagy including the formation of GFP-LC3B-positive puncta, production of phosphatidylinositol-3-phosphate, and activation of the transcription factor TFEB. When combined effects were assessed, several trans-unsaturated fatty acids including elaidic acid (the trans-isomer of oleate), linoelaidic acid, trans-vaccenic acid and palmitelaidic acid, were highly efficient in suppressing autophagy and endoplasmic reticulum stress induced by palmitic, but not by oleic acid. Elaidic acid also inhibited autophagy induction by palmitic acid in vivo, in mouse livers and hearts. We conclude that the well-established, though mechanistically enigmatic toxicity of trans-unsaturated fatty acids may reside in their capacity to abolish cytoprotective stress responses induced by saturated fatty acids.

Keywords: Aging; Cytoprotection; Fasting; Immune response; Immunosurveillance; Ketogenic diet; Obesity; Systems biology.


Figures

Unlabelled Image
Graphical abstract
Fig. 1
Fig. 1
Cellular uptake and autophagy induction by selected FAs. (A, B) Human osteosarcoma U2OS cells were treated with the indicated FAs (saturated FAs in black, trans-unsaturated FAs in blue, cis-unsaturated FAs in red, and unsaturated FAs with both trans- and cis- bonds in green) or were left untreated (A, Control in B) for 6 h. Intracellular FA content was measured by GC/MS after cell lysis, and the fraction of each FA was calculated. Fractions of basal FA levels in untreated conditions are reported as a pie chart in A, as relative concentrations summing up to 100%. Changes in the relative concentrations upon addition of each FA are shown as a bar chart in B, the black part of the columns indicating the increase. (C, D) U2OS cells stably expressing GFP-LC3 were treated with FAs as in A. After fixation the cells were imaged and the area of GFP-LC3+ dots was assessed as an indicator for autophagy. Data are means ± SEM of at least three independent experiments (* = p < 0.05; **=p < 0.01;***=p < 0.001). Representative images are shown in C. Scale bar equals 10 μm. (E) U2OS cells were treated with 500 μM OL, EL, or PA as indicated or were left untreated (Control) in the presence or absence of chloroquine for 6 h. Then, cells were processed to measure LC3 lipidation and p62 degradation by SDS-PAGE and immunoblot. G3PD was measured as a loading control. (F) U2OS WT and ATG5 knockout cells (ATG5KO) were treated with 500 μM OL, EL, or PA for or were left untreated (Control) for 6 h and were then collected for protein separation by SDS-PAGE and immunoblot. LC3 lipidation and p62 degradation was assessed by specific antibodies and GAPDH was measured as a loading control.
Fig. 2
Fig. 2
Autophagy-related signaling pathways elicited by FAs. (A-F) FYVE-RFP stable expressing U2OS cells (A, B), GFP-TFEB stably expressing U2OS cells (C, D), and wild-type U2OS cells (E, F) were treated with 500 μM FAs as indicated for 6 h (A-F) and 16 h (E,F) . Images from fixed cells were acquired and the area of FYVE-RFP+ dots was measured as an indicator for autophagy induction (B). Nuclear and cytoplasmic GFP-TFEB fluorescence intensities were measured and the ratio between nuclear and cytoplasmic values (GFPnuc/cyto ratio) was calculated to indicate TFEB nuclear translocation (D). Nuclei were stained with Hoechst 33342 and the number of cells harboring normal nuclei (i.e. non pyknotic, “healthy cells”) was determined (F). Data are means ± SEM of at least three independent experiments (*=p < 0.05;**=p < 0.01;*** = p < 0.001). Representative images of FYVE-RFP, GFP-TFEB, and viability are shown in A, C, E respectively. Scale bar equals 10 μm in A, C, and 50 μm in E.
Fig. 3
Fig. 3
Effects of FAs on the endoplasmic reticulum stress response. pSMALB-ATF4.5rep (A, B) and XBP1-ΔDBD-venus (C, D) stable expressing U2OS cells were treated with 500 μM FAs as indicated or 3 μM thapsgargin or tunicamycin as positive controls for 16 h. After fixation, ATF4-GFP and XBP1-venus cytoplasmic intensities were measured and then the percentage of cells with cytoplasmic GFP intensity higher than threshold was calculated (B, D). Data are means ± SEM of at least three independent experiments (*=p < 0.05; **=p < 0.01; ***=p < 0.001). Representative images of ATF4-GFP or XBP1-venus are respectively shown in (A,C), scale bar equals 10 μm. (E, F) U2OS (E) and HepG2 (F) cells were treated with 250 μM or 500 μM FAs as indicated or 3 μM thapsigargin as a positive control for 16 h. Then, proteins were separated by SDS PAGE and immunoblots were performed to detect spliced XBP1 (XBP1s), phosphorylated p38 (also known as mitogen-activated protein kinases (MAPK)) and lipidated LC3.
Fig. 4
Fig. 4
Effects of FAs on the Golgi apparatus and deacetylases expression. (A, B) Wild-type and GALT1-GFP stably expressing U2OS cells were treated with 500 μM FAs as indicated or 10 μM golgicide A as positive controls for 16 h. Golgi apparatus from fixed cells was clustered into “fragmented” or “degraded” according to the area of the fluorescent signal, cytoplasmic intensity and distribution within the cytoplasm; the percentage of cells harboring one or the other phenotype was thereafter calculated (B). Representative images of control, palmitate, oleate, and elaidic acid are shown in A. Scale bar equals 10 μm. (C, D) U2OS cells were treated with 500 μM FAs or left untreated as indicated for 6 h. After fixation, cells were treated with specific antibodies to block acetylated tubulin, followed by immunofluorescence employing antibodies specific for proteins with acetylated lysines. Acetylated lysine cytoplasmic fluorescence intensities were measured. Data are means ± SEM of at least three independent experiments (*=p < 0.05; **=p < 0.01) (D). Representative images of control, palmitate, oleate, and elaidic acid are shown in C. Scale bar equals 10 μm.
Fig. 5
Fig. 5
Systemic analysis of the biological effects of FAs. (A) FAs were hierarchically clustered after Z-score calculation of each measured parameter, then reported in heatmap (GOH, percent of cells with normal Golgi morphology; VIAB, healthy cell count; ACE acetylated protein intensity; GOS, percent of cells showing fragmented Golgi apparatus; GFP-TFEBnuc/cyto intensity ratio; XBP1/ATF4, percent of cells with high venus/GFP intensity; GOV, percent of cells with degraded Golgi apparatus; INT, fractional increase of cellular intake). (B) Correlation matrix was built from Z-scores; the diagonal shows the distribution of Z-scores for each parameter; upper panel shows the Pearson correlation coefficient (*=p < 0.05;**=p < 0.01;***=p < 0.001); lower panel depicts bi-parametric plots together with linear regression (red line). (C) A set of chemical descriptors (MW, molecular weight; RBC, rotable bound count; BSC, bond stereocenter count; NCU, number of cis-unsaturations; other abbreviations are reported in the web page http://sysbiolab.bio.ed.ac.uk/wiki/index.php/CDK_Small_Molecule_Descriptors) was calculated for each FA, and then correlated with the Z-scores of measured biological parameters (doi:10.17632/3d2zvjbh7z.1); Pearson correlation coefficients are depicted on the correlation matrix as dots, with size representing the absolute value, and colour the real value (ranging from −1, red to +1), blue. (D) Coordinates from the two main dimensions of a principal component analysis are plotted with the axes reporting the percentage of inertia. Polygons represent groups in which FAs were classified after K-Means analysis. Numbers depicted above each dot represents the carbon chain length as well as NCU for each corresponding FA.
Fig. 6
Fig. 6
Inhibitory effects of elaidic acid on autophagy induction by saturated FAs. (A, B) U2OS cells stably expressing GFP-LC3 were treated with 500 μM FA, or 10 μM of the autophagy-inducer subset from the ENZO SCREEN-WELL autophagy library, in the presence or absence of 500 μM EL for 6 h. Autophagy was assessed after fixation by measuring the area of LC3 dots within each cell. The relative difference with and without EL co-treatment was calculated and is reported as barchart in A. Representative images are shown in B. Scale bar equals 10 μm. (C) U2OS cells were treated with either vector (ethanol 0.5%), 500 μM OL, PA, or stearate in the presence or absence of 500 μM elaidate for 6 h. Thereafter, LC3 lipidation and p62 degradation and p38 activation were measured by immunoblot as indicators for autophagy. (D) U2OS cells treated as in C with OL, PA, and stearate in the presence or absence of elaidate, were harvested and analyzed with GC/MS to measure the intracellular FA concentration and to test the effect of EL on FA uptake into cells. Data are means ± SEM of at least three independent experiments (*=p < 0.05, **=p < 0.01, ***=p < 0.001, FA concentration in cells treated with a single FA compared to cells treated with vector control; #=p < 0.05, FA concentration in cells receiving EL co-treatment versus cells treated with single FA). (E, F) FYVE-RFP (E) and GFP-TFEB (F) stable expressing U2OS cells were treated as in C. After fixation, images were acquired and the area of FYVE+ dots and TFEB nuclear translocation were analyzed. Data are means ± SEM of at least three independent experiments (* = p <0.05, **=p < 0.01, ***=p < 0.001, FYVE dots surface or GFP-TFEBnuc/cyto ratio in cells with EL as compared to cells that were not co-treated with EL).
Fig. 7
Fig. 7
Dose response and kinetic analysis of the effects of elaidic acid on autophagy induction by various FAs. (A, B, C) U2OS cells stably expressing GFP-LC3 were treated with increasing concentrations of EL (A,B,C), linoelaidic acid, transvaccenic acid, or palmitelaidic acid (C), and co-treated or not with the indicated increasing concentrations of PA (A,C) or OL (B) for 2, 4, 6, 16 (A,B) or 24 h (A, B, C). After fixation, phosphorylated eIF2α was visualized by immunofluorescence. For each treatment, the degree of autophagy was measured by the quantifying the area of LC3 dots. ER-Stress was monitored by measuring the phosphorylation eIF2α by immunofluorescence, and the loss of viability was quantitated by enumerating the number of cells depicting a healthy morphotype. Data is depicted as a heatmap with maximum effects depicted in red and minimal effects in blue. (D) C57BL/6 mice were injected intraperitoneally with vehicle only, 100 mg/kg PA, 100 mg/kg EL, or the combination of the two FAs. 2 h later, mice were euthanized and heart and liver were collected for immunoblotting. LC3 lipidation and p62 degradation were detected to indicate autophagy activity. GAPDH levels were monitored to ensure equal loading. (E) Transgenic mice harboring GFP-LC3 reporter were treated with either PA, EL, or their combination. Frozen sections were made from hearts and thereafter imaged on a fluorescent microscope. Mean numbers of GFP-LC3 dots per cell were determined on the obtained images. Results indicated on the bar chart represent the means from three mice. *p < 0.05. Representative micrographs of GFP-LC3 dots are shown together with barchart; dots local contrast was enhanced for better visibility. Scale bar represents 10 μm. (F) MEFs wildtype (WT) or carrying a non phoshorylable knock in mutation in eIF2α (KI) both stably expressing GFP-LC3 were treated with increasing concentrations of OL or PAL, in the presence or the absence of 500 μM EL for 2, 4 and 6 h. Cells were imaged after fixation and autophagy levels were measured by measuring the total area of LC3 dots per cell. Quantifications are depicted as a heatmap with maximum effects in red and minimal effects in blue.

Similar articles

Cited by

References

    1. Bankaitis V.A. Unsaturated fatty acid-induced non-canonical autophagy: unusual? Or unappreciated? EMBO J. 2015;34:978–980. - PMC - PubMed
    1. Bento C.F., Renna M., Ghislat G., Puri C., Ashkenazi A., Vicinanza M., Menzies F.M., Rubinsztein D.C. Mammalian autophagy: how does it work? Annu. Rev. Biochem. 2016;85:685–713. - PubMed
    1. Brostow D.P., Hirsch A.T., Collins T.C., Kurzer M.S. The role of nutrition and body composition in peripheral arterial disease. Nat. Rev. Cardiol. 2012;9:634–643. - PMC - PubMed
    1. Brownell K.D., Pomeranz J.L. The trans-fat ban—food regulation and long-term health. N. Engl. J. Med. 2014;370:1773–1775. - PubMed
    1. Buttner S., Eisenberg T., Carmona-Gutierrez D., Ruli D., Knauer H., Ruckenstuhl C., Sigrist C., Wissing S., Kollroser M., Frohlich K.U., Sigrist S., Madeo F. Endonuclease G regulates budding yeast life and death. Mol. Cell. 2007;25:233–246. - PubMed

MeSH terms