

The Evolution of Physician Practice Styles: Evidence from Cardiologist Migration
- PMID: 29607002
- PMCID: PMC5876705
- DOI: 10.1257/pol.20160319
The Evolution of Physician Practice Styles: Evidence from Cardiologist Migration
Abstract
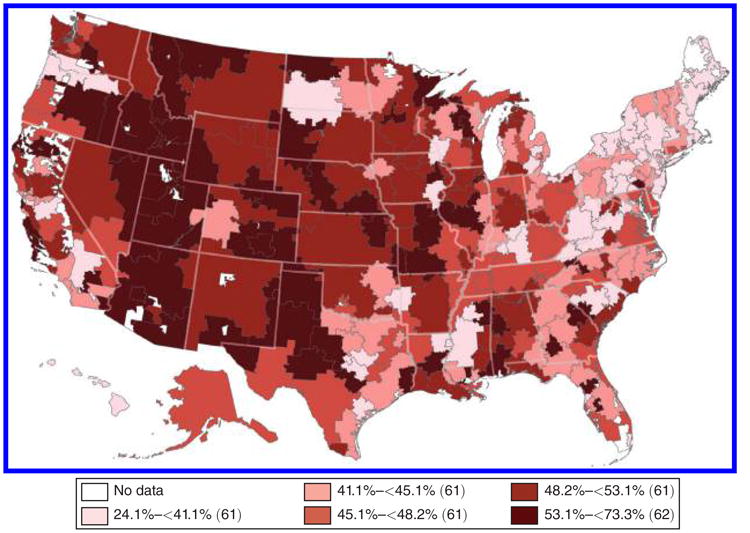
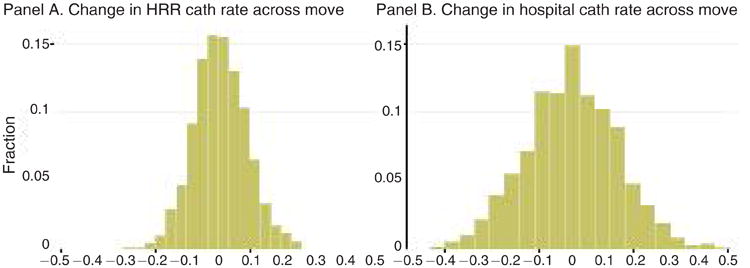
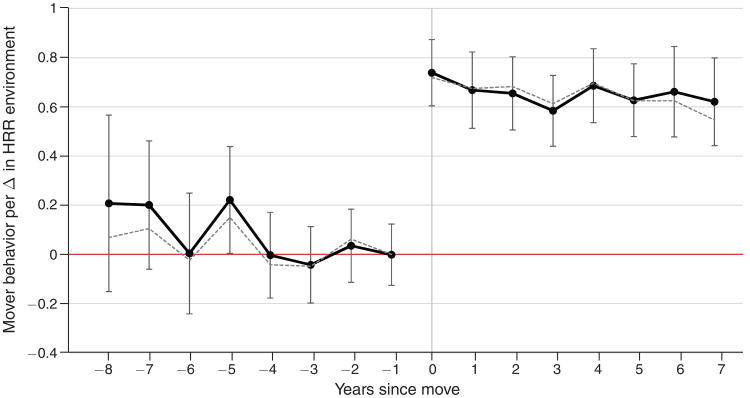
Physician treatment choices for observably similar patients vary dramatically across regions. This paper exploits cardiologist migration to disentangle the role of physician-specific factors such as preferences and learned behavior versus environment-level factors such as hospital capacity and productivity spillovers on physician behavior. Physicians starting in the same region and subsequently moving to dissimilar regions practice similarly before the move. After the move, physician behavior in the first year changes by 0.6-0.8 percentage points for each percentage point change in practice environment, with no further changes over time. This suggests environment factors explain between 60-80 percent of regional disparities in physician behavior.
Figures

Similar articles
-
Variation in Physician Practice Styles within and across Emergency Departments.PLoS One. 2016 Aug 12;11(8):e0159882. doi: 10.1371/journal.pone.0159882. eCollection 2016. PLoS One. 2016. PMID: 27517464 Free PMC article.
-
Hospital-cardiologist integration often occurs without a practice acquisition.Health Serv Res. 2022 Apr;57(2):333-339. doi: 10.1111/1475-6773.13929. Health Serv Res. 2022. PMID: 34921737 Free PMC article.
-
Long term regional migration patterns of physicians over the course of their active practice careers.Rural Remote Health. 2007 Oct-Dec;7(4):812. Epub 2007 Nov 15. Rural Remote Health. 2007. PMID: 18028001
-
Providers, peers and patients. How do physicians' practice environments affect patient outcomes?J Health Econ. 2023 May;89:102741. doi: 10.1016/j.jhealeco.2023.102741. Epub 2023 Mar 4. J Health Econ. 2023. PMID: 36878022
-
The global health workforce shortage: role of surgeons and other providers.Adv Surg. 2008;42:63-85. doi: 10.1016/j.yasu.2008.04.006. Adv Surg. 2008. PMID: 18953810 Review.
Cited by
-
Regional variation in prescription drug spending: Evidence from regional migrants in Sweden.Health Econ. 2022 Sep;31(9):1862-1877. doi: 10.1002/hec.4552. Epub 2022 Jun 16. Health Econ. 2022. PMID: 35709331 Free PMC article.
-
Place-Based Drivers of Mortality: Evidence from Migration.Am Econ Rev. 2021 Aug;111(8):2697-2735. doi: 10.1257/aer.20190825. Am Econ Rev. 2021. PMID: 34887592 Free PMC article.
-
Cancer prevention, risk reduction, and control: opportunities for the next decade of health care delivery research.Transl Behav Med. 2021 Nov 30;11(11):1989-1997. doi: 10.1093/tbm/ibab109. Transl Behav Med. 2021. PMID: 34850934 Free PMC article.
-
The unexpected costs of expertise: evidence from highly specialized physicians.Front Public Health. 2024 Mar 4;12:1108254. doi: 10.3389/fpubh.2024.1108254. eCollection 2024. Front Public Health. 2024. PMID: 38500725 Free PMC article.
-
Does Medical Malpractice Law Improve Health Care Quality?J Public Econ. 2016 Nov;143:142-158. doi: 10.1016/j.jpubeco.2016.09.002. Epub 2016 Sep 11. J Public Econ. 2016. PMID: 28479642 Free PMC article.
References
-
- Amsterdam Ezra A, Wenger Nanette K, Brindis Ralph G, Casey Donald E, Ganiats Theodore G, Holmes David R, Jaffe Allan S, et al. 2014 AHA/ACC Guideline for the Management of Patients with Non-ST-Elevation Acute Coronary Syndromes: Executive Summary. Journal of the American college of cardiology. 2014;64(24):2645–87. - PubMed
-
- Angrist Joshua D. The perils of peer effects. Labour Economics. 2014;30:98–108.
-
- Baicker Katherine, Chandra Amitabh. Medicare Spending, the Physician Workforce, and Benefciaries' Quality of Care. Health Affairs. 2004;W4:W184–97. - PubMed
-
- Barnato Amber E, Herndon M Brooke, Anthony Denise L, Gallagher Patricia M, Skinner Jonathan S, Bynum Julie PW, Fisher Elliott S. Are Regional Variations in End-of-Life Care Intensity Explained by Patient Preferences? A Study of the US Medicare Population. medical care. 2007;45(5):386–93. - PMC - PubMed
-
- Bronnenberg Bart J, Dubé Jean-Pierre H, Gentzkow Matthew. The Evolution of Brand Preferences: Evidence from Consumer Migration. American Economic review. 2012;102(6):2472–2508.
Grants and funding
LinkOut - more resources
Full Text Sources
Other Literature Sources