. 2012 Jul 1;1(1):32-43.
doi: 10.4161/intv.21223. eCollection 2012.

Intravital third harmonic generation microscopy of collective melanoma cell invasion: Principles of interface guidance and microvesicle dynamics

Affiliations

Intravital third harmonic generation microscopy of collective melanoma cell invasion: Principles of interface guidance and microvesicle dynamics

Bettina Weigelin et al. Intravital. .

Abstract

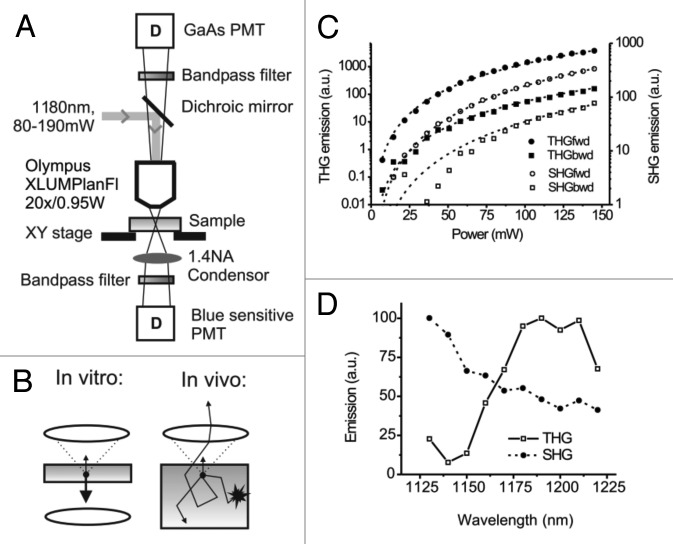
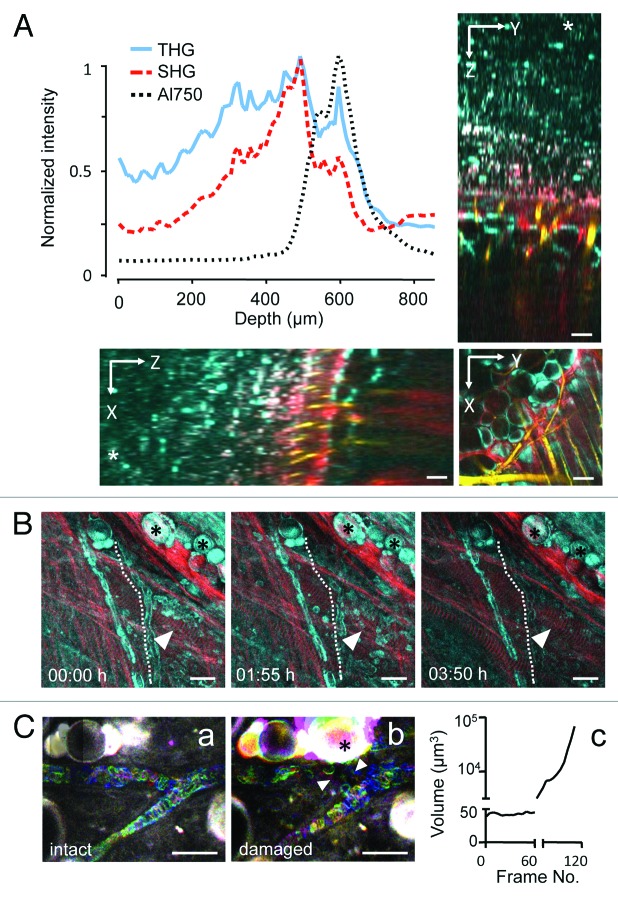
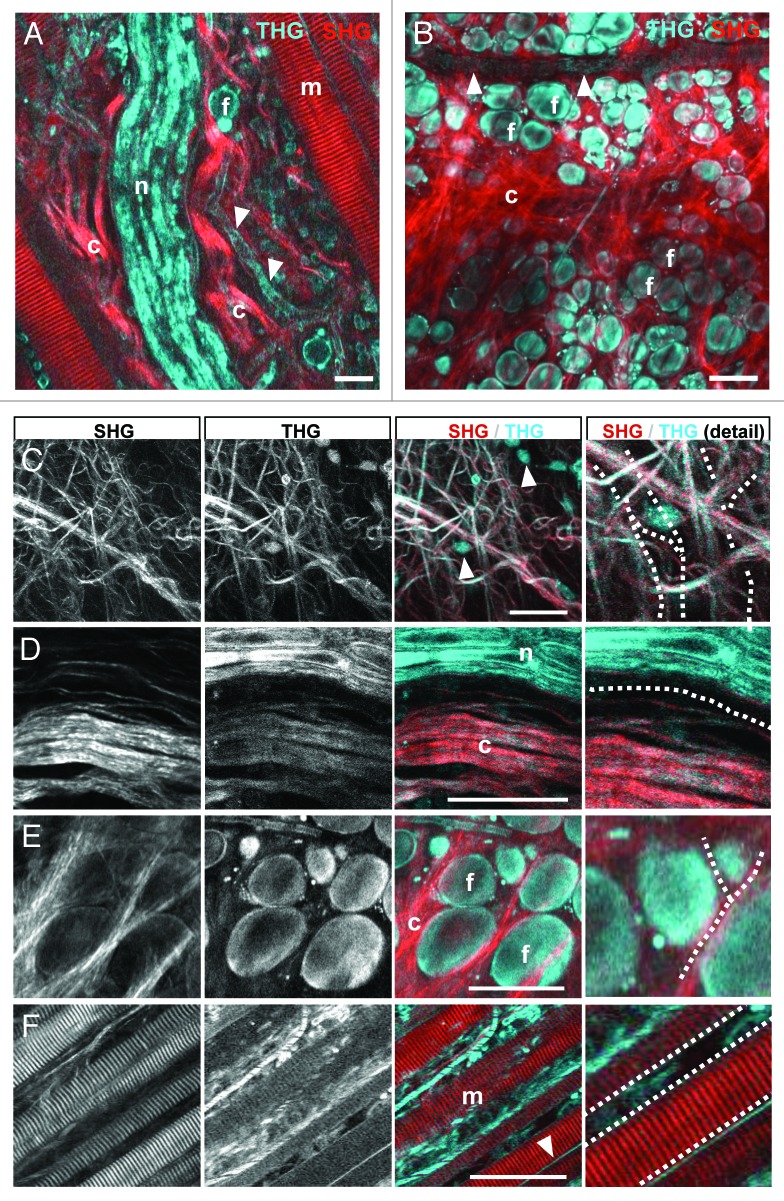
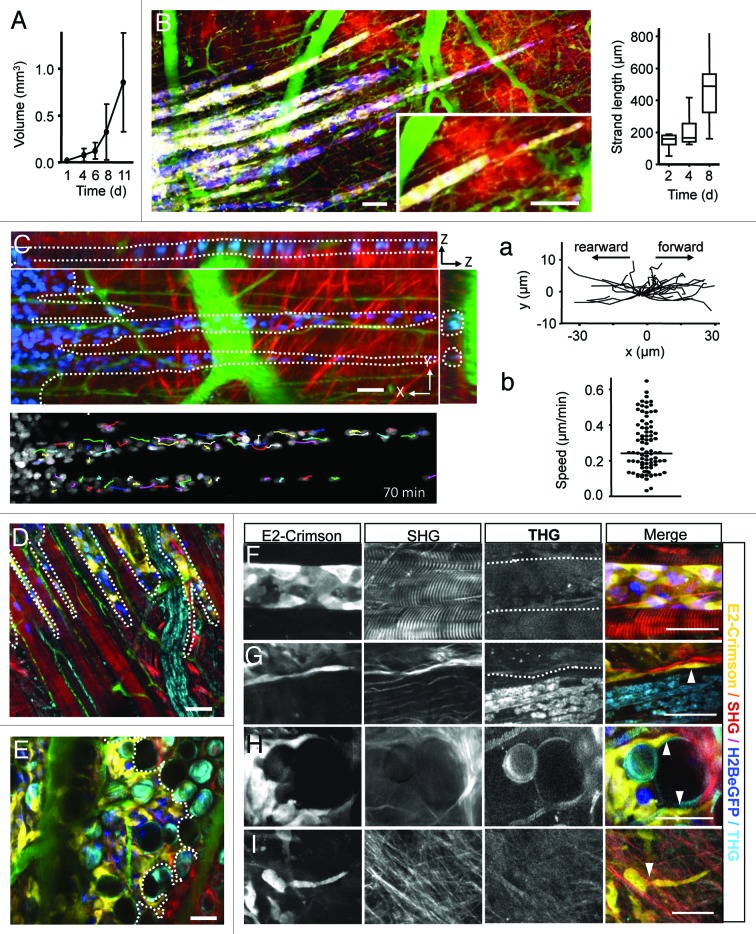
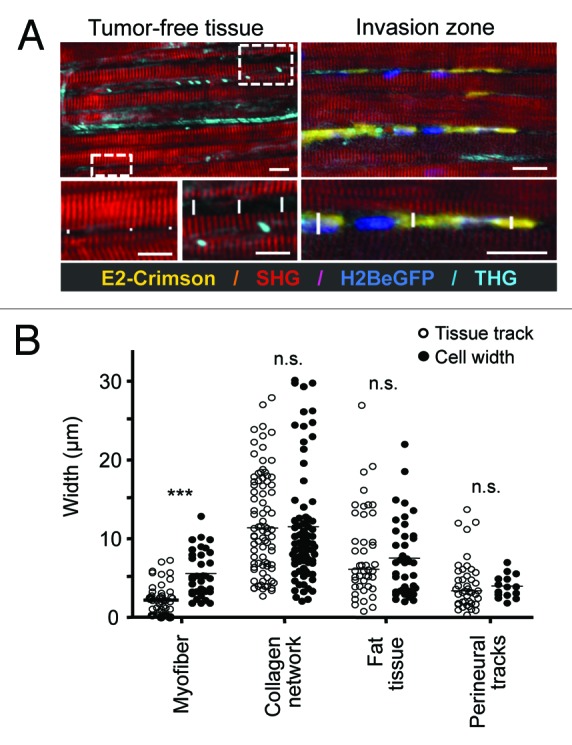
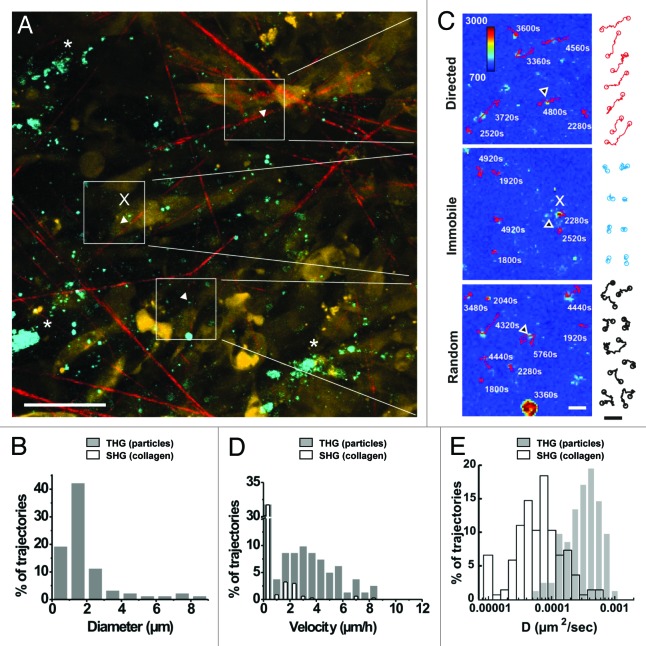
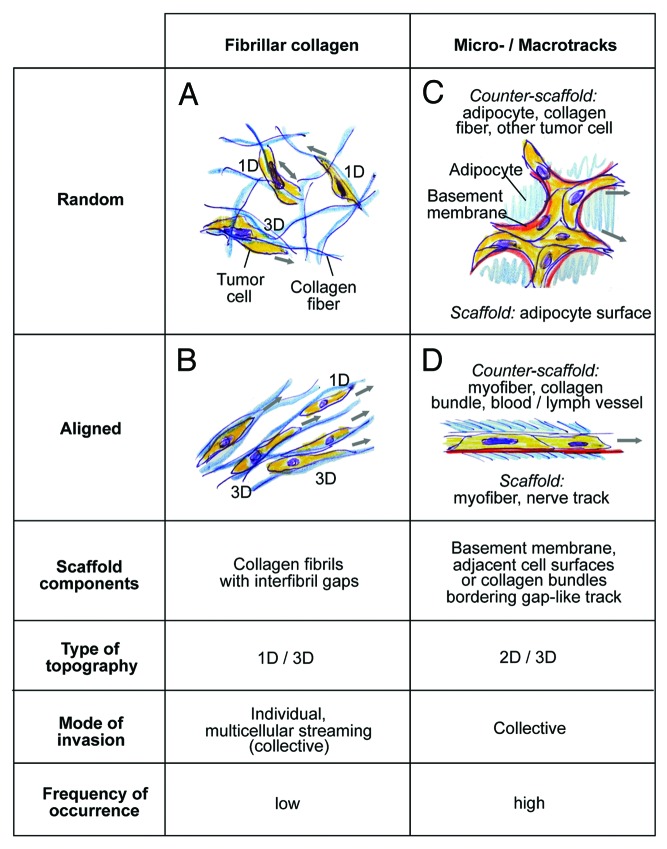
Cancer cell invasion is an adaptive process based on cell-intrinsic properties to migrate individually or collectively, and their adaptation to encountered tissue structure acting as barrier or providing guidance. Whereas molecular and physical mechanisms of cancer invasion are well-studied in 3D in vitro models, their topographic relevance, classification and validation toward interstitial tissue organization in vivo remain incomplete. Using combined intravital third and second harmonic generation (THG, SHG), and three-channel fluorescence microscopy in live tumors, we here map B16F10 melanoma invasion into the dermis with up to 600 µm penetration depth and reconstruct both invasion mode and tissue tracks to establish invasion routes and outcome. B16F10 cells preferentially develop adaptive invasion patterns along preformed tracks of complex, multi-interface topography, combining single-cell and collective migration modes, without immediate anatomic tissue remodeling or destruction. The data suggest that the dimensionality (1D, 2D, 3D) of tissue interfaces determines the microanatomy exploited by invading tumor cells, emphasizing non-destructive migration along microchannels coupled to contact guidance as key invasion mechanisms. THG imaging further detected the presence and interstitial dynamics of tumor-associated microparticles with submicron resolution, revealing tumor-imposed conditioning of the microenvironment. These topographic findings establish combined THG, SHG and fluorescence microscopy in intravital tumor biology and provide a template for rational in vitro model development and context-dependent molecular classification of invasion modes and routes.

Keywords: adipocyte; intravital multiphoton microscopy; melanoma; microparticles; myofiber; second harmonic generation; third harmonic generation; tumor invasion; tumor microenvironment.


Figures

None
Figure 1. Beam path and efficiency of forward and backward third- and second-harmonic generation. (A) Beam path and main components of the multiphoton microscope including detectors (D) and numerical aperture (A). (B) Detection of THG and backward scattered emission from thick light-absorbing in vivo samples (right), compared with THG detection of most in vitro or thin ex vivo samples (left). (C) THG and SHG emission from mouse fibrosarcoma (MCA-101) cells embedded in collagen matrix, as a function of excitation power. Emission was detected in the forward (fwd) and backward (bwd) direction. To separate emission from the background, images were background subtracted and thresholded before the average intensity was calculated in regions of interest containing SHG or THG emitting structures (collagen, intracellular vesicles). THG emission showed best fit with a model function dependent on the third-order of the excitation power (reduced-Chi-sqr = 5 and 52 for forward and backward detection, respectively; dashed lines; 5% relative error in excitation power), whereas SHG emission showed best fit with second-order excitation (Chi-sqr = 0.58 and 360 for forward and backward detection, respectively). (D) THG and SHG excitation spectra of the structures of the mouse dermis in backward direction (compare to Fig. 3). Images were acquired using a custom Python script, controlling OPO wavelength, attenuator and tube lens settings to maintain constant excitation power (100 mW) and focal plane over the scanned wavelength range (1130–1220 nm). Curves were normalized to take fluctuations of the laser power into account.
None
Figure 2. Depth efficiency and phototoxicity of backward THG. (A) THG, SHG and AlexaFluor750 signal intensity as function of depth obtained from a 870 µm deep z-stack into the mouse dermis (*, level of the cover glass above the tissue). Images were acquired with a z-resolution of 10 µm, excitation wavelength of 1180 nm and an excitation power of 150mW under the objective. Images were background subtracted and average intensity of THG/SHG or AlexaFluor750 signals over the z-profile was plotted. THG (cyan) was detected up to 650 µm, similarly to SHG (red) and AlexaFluor750 (yellow). (B) Representative time points of THG (cyan) and SHG (red) during time-lapse recording of dermal tissue [λ(excitation) = 1180nm; 110mW excitation power under the objective]. Z-scans of 80 µm tissue volume were acquired with z-steps of 5 µm and frame intervals of 60 sec (230 frames; 3.8 h observation period). Unperturbed tissue structures, including fat cells (asterisks), muscle fibers (arrowheads) and erythrocyte flow in capillaries (dotted line). (C) Erythrocyte flow (temporal color coded) morphology of adipocytes (asterisk). (a) Continuous exposure of small (60 µm × 70 µm) scan field for 60 frames (frame rate: 1.1/sec) at 1180nm excitation and 130mW excitation intensity. (b and c) Doubling of the frame rate (0.6/sec) followed by tissue damage, detected by swelling of adipocytes (asterisk) and intravascular coagulation and perturbed erythrocyte flow (arrowheads). Scale bars, 20µm.
None
Figure 3. THG/SHG 3D reconstruction of tissue interfaces in native dermis. Backward THG/SHG were acquired at 1180nm excitation and 100–130mW laser intensity under the objective. THG was generated by cellular interfaces of fat cells (A, B and E); flowing erythrocytes labeling perfused blood vessels (A and B; arrowheads); cell bodies interspersed in loose connective tissue (C; arrowheads); matrix interfaces including collagen fiber bundles (C and D); peripheral nerves (A, D); striated muscles (F) and outer membranes of myofibers (F; arrowhead). SHG was confined to collagen bundles (A, B and D) and striated muscle fibers (A and F). Combined THG/SHG revealed tissue tracks and spaces available for tumor cell invasion (examples highlighted in C-F as dotted lines). Scale bars, 50µm. F, fat cells; m, myofiber; n, nerve; c, collagen.
None
Figure 4. B16F10 melanoma invasion along dermal tissue interfaces. (A) B16F10 tumor volume growth over time. Error bars, mean ± SD (n = 8). (B) File-like collective invasion of mosaic tumors (compare to Fig. S2 ) into the deep dermis. Invasion strands progressed on average 70 µm/d (right graph) and appeared as coherent and tightly organized cell strains of near-constant diameter, except for occasional detachment of single cells or small cell files at the tip of the strands (B, inset). (C) Time-lapse microscopy and single-nucleus tracking show high intra-strand dynamics in rearward and forward direction (a) with median velocities of 0.25 µm/min (b). During migration individual tumor cells remained within the 3D spaces defined by tissue interfaces (C, dotted lines) with leading edges strongly adapted to tissue confinement (D and E; dotted lines). Linear, aligned tracks along muscle fibers and nerves guiding file-like collective invasion (D), while irregular shaped spaces within fat tissue supported broad and diffusely organized collective invasion patterns (E). Invading tip cells preferentially moved along tissue interfaces such as linear perimuscular (F; dotted lines) and perineural (G; dotted lines) tracks, and irregular trails consisting of adipocyte interfaces (H) or collagen fiber networks (I). Cell body adapting to existing matrix spaces (F–I; arrowheads). Backward THG/SHG, E2-Crimson and AlexaFluor750 were excited with 1180nm (100–130mW), eGFP was excited with 910nm (20–40 mW). Color scale: yellow, E2-Crimson (tumor cytoplasm); blue, histone-2B/eGFP (tumor nuclei); green, AlexaFluor750 (blood vessels); red, SHG; cyan, THG. Scale bars, 50 µm.
None
Figure 5. Quantification of native tissue spaces and tumor cell adaptation to pre-existing tissue tracks. (A) The diameter of tumor-free tissue tracks quantified from THG and SHG imaging (left) was compared with the diameter of invading cells, visualized by fluorescence of the cytoplasm and/or the nucleus. As example, perimuscular invasion is shown. Scale bar: 20µm. (B) Diameters of THG-/SHG-negative spaces and tracks in native, tumor-free tissue, compared with the diameter of tumor cell bodies during invasion. Tracks along myofibers were significantly widened by tumor cell infiltration (two-tailed Mann-Whitney test; *** = p < 0.0001), while all other tissue tracks maintained their original dimensions and required tumor cell adaptation (n.s., not significant). For each condition, at least three independent tissue samples were quantified.
None
Figure 6. In vivo detection of microparticle location and dynamics. (A) Overview of THG emitting randomly distributed microparticles (white arrowheads) and aggregated, likely intracellular vesicles (asterisks) detected at the border of a B16F10 tumor (d13) nearby collagen fiber-containing stroma. (B) The distribution of particle sizes determined from the cross-section of the THG signal. (C) Representative tracks of individual microparticles over 49 frames (98 min) showed subpopulations of immobilization (x, immobilized on cells or on collagen fibers), or random or directed diffusion kinetics. (D) Distribution of microparticle velocities (gray bars, 82 trajectories) relative to the distribution of velocities of individually tracked marker regions on collagen fibers (empty bars, 137 trajectories). (E) Logarithmic distribution of diffusion constant of individual trajectories from microparticles (gray bars) and second harmonic generating spots on collagen fibers (empty bars). Bars, 50µm (left image) or 5µm (right images and trajectories).
None
Figure 7. Classification of in vivo scaffold organization and corresponding migration modes in the B16F10 model. Both, connective tissue composed of predominantly fibrillar collagen or surrounding cell structures may show random or aligned organization, with impact on the invasion mode of B16F10 cells. Blue, THG-/SHG-positive scaffold; red, basement membrane, not detected by MPM of native tissue structures; yellow, tumor cells. 3D topography corresponds to either 1D (migration along a single fiber) 2D topography (migration along a surface) and 3D (when the cell bodies are confined by additional tissue structures apically or laterally interfaces, or move between multiple collagen fibers).

References

    1. Sahai E. . Illuminating the metastatic process. Nat Rev Cancer 2007; 7:737 - 49; http://dx.doi.org/10.1038/nrc2229; PMID: 17891189 - DOI - PubMed
    1. Bravo-Cordero JJ, Hodgson L, Condeelis J. . Directed cell invasion and migration during metastasis. Curr Opin Cell Biol 2012; 24:277 - 83; http://dx.doi.org/10.1016/j.ceb.2011.12.004; PMID: 22209238 - DOI - PMC - PubMed
    1. Wolf K, Mazo I, Leung H, Engelke K, von Andrian UH, Deryugina EI, et al. . . Compensation mechanism in tumor cell migration: mesenchymal-amoeboid transition after blocking of pericellular proteolysis. J Cell Biol 2003; 160:267 - 77; http://dx.doi.org/10.1083/jcb.200209006; PMID: 12527751 - DOI - PMC - PubMed
    1. Friedl P, Gilmour D. . Collective cell migration in morphogenesis, regeneration and cancer. Nat Rev Mol Cell Biol 2009; 10:445 - 57; http://dx.doi.org/10.1038/nrm2720; PMID: 19546857 - DOI - PubMed
    1. Friedl P, Wolf K. . Plasticity of cell migration: a multiscale tuning model. J Cell Biol 2010; 188:11 - 9; http://dx.doi.org/10.1083/jcb.200909003; PMID: 19951899 - DOI - PMC - PubMed