. 2018 Jun;36(5):442-450.
doi: 10.1038/nbt.4103. Epub 2018 Mar 28.

Simultaneous single-cell profiling of lineages and cell types in the vertebrate brain

Affiliations

Simultaneous single-cell profiling of lineages and cell types in the vertebrate brain

Bushra Raj et al. Nat Biotechnol. 2018 Jun.

Abstract

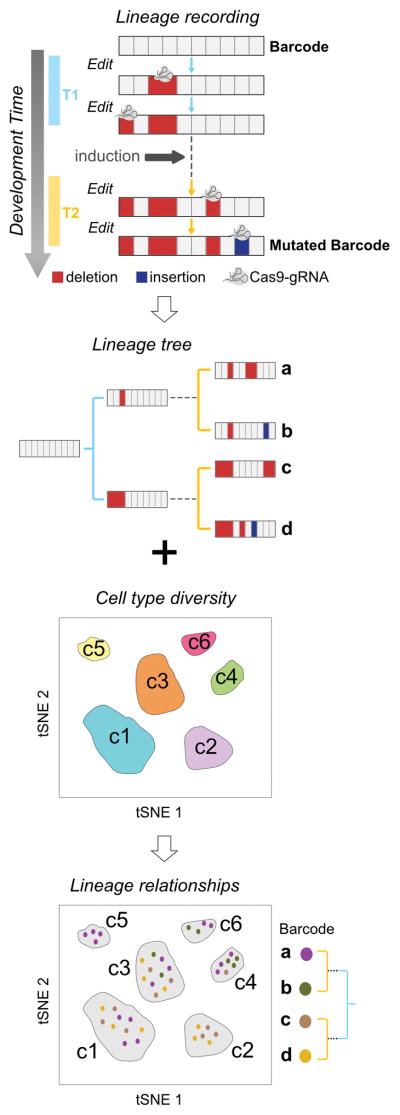
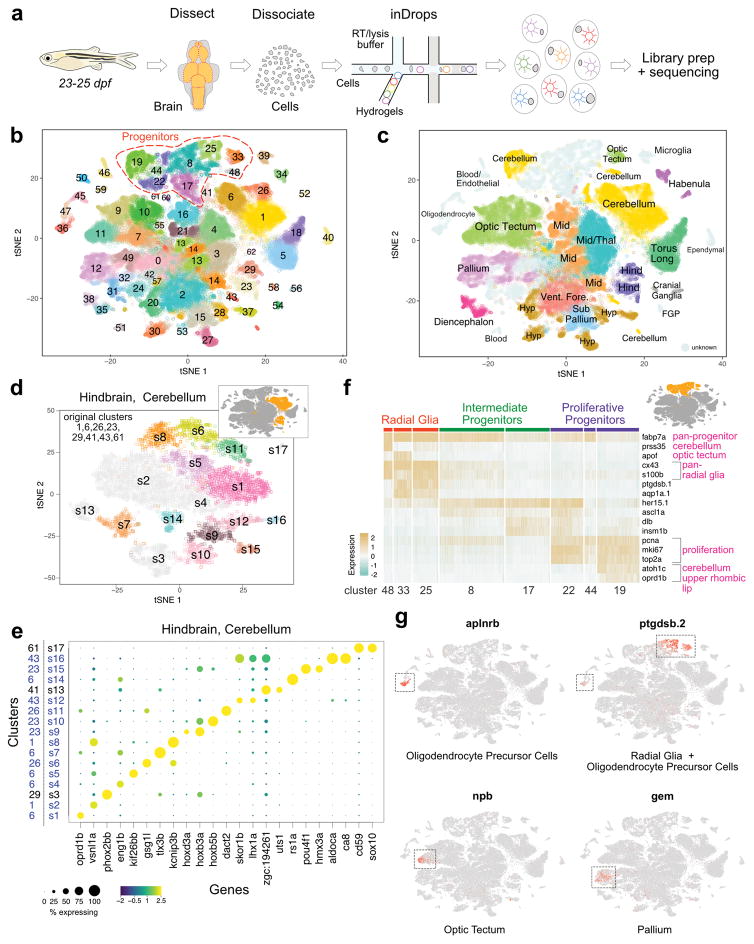
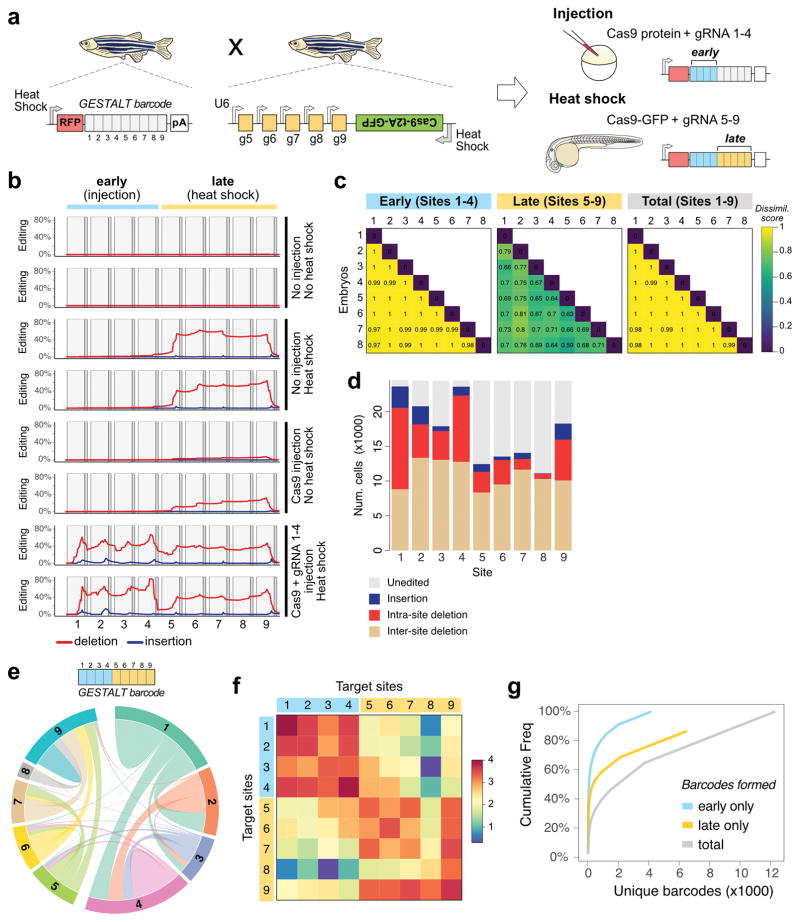
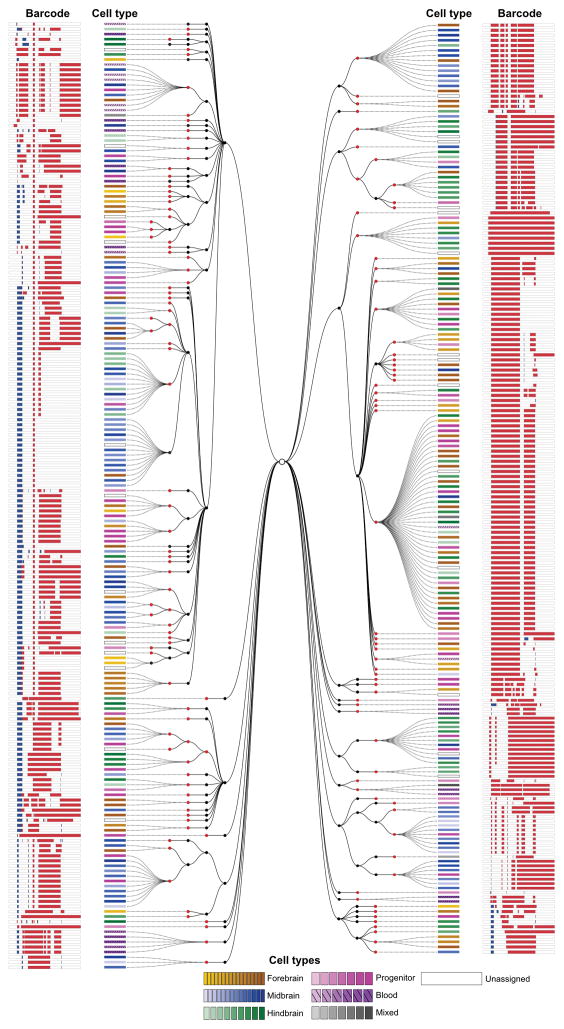
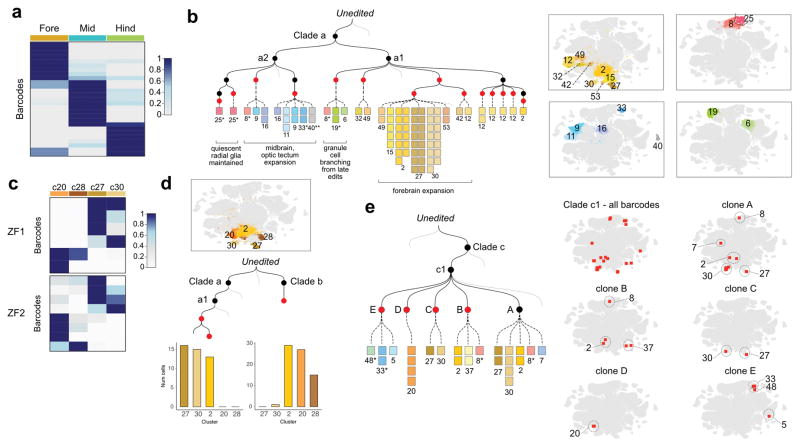
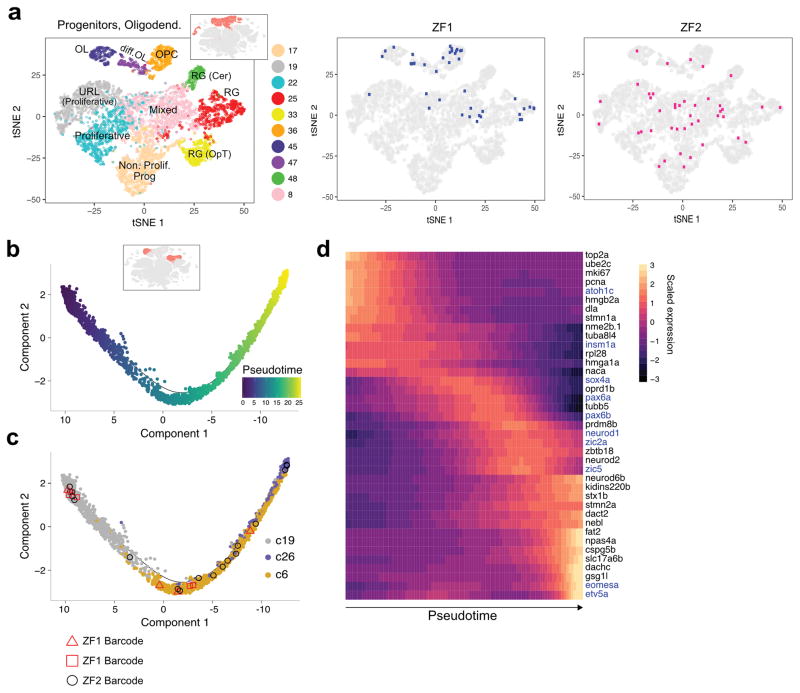
The lineage relationships among the hundreds of cell types generated during development are difficult to reconstruct. A recent method, GESTALT, used CRISPR-Cas9 barcode editing for large-scale lineage tracing, but was restricted to early development and did not identify cell types. Here we present scGESTALT, which combines the lineage recording capabilities of GESTALT with cell-type identification by single-cell RNA sequencing. The method relies on an inducible system that enables barcodes to be edited at multiple time points, capturing lineage information from later stages of development. Sequencing of ∼60,000 transcriptomes from the juvenile zebrafish brain identified >100 cell types and marker genes. Using these data, we generate lineage trees with hundreds of branches that help uncover restrictions at the level of cell types, brain regions, and gene expression cascades during differentiation. scGESTALT can be applied to other multicellular organisms to simultaneously characterize molecular identities and lineage histories of thousands of cells during development and disease.


Conflict of interest statement

COMPETING FINANCIAL INTERESTS

A.M.K. is a co-inventor on a patent application (PCT/US2015/026443) that includes some of the ideas described in this article. A.M.K. is a cofounder and science advisory board member of 1CellBio. The rest of the authors declare no competing financial interests.

Figures

Figure 1
Figure 1. scGESTALT: Simultaneous recovery of transcriptomes and lineage recordings from single cells
During development, CRISPR-Cas9 edits record cell lineage in mutated barcodes (a,b,c,d). Barcode editing occurs at early (T1, blue) and late (T2, yellow) timepoints during development. Simultaneous recovery of transcriptomes and barcodes from the same cells can be used to generate cell lineage trees and also classify them into discrete cell types (c1 – c6).
Figure 2
Figure 2. Cell type diversity in the juvenile zebrafish brain
a. Juvenile zebrafish brains were dissected, dissociated and processed by inDrops. b. t-SNE plot of 58,492 cells (n=6 independent animals for whole brain analysis, n=6 independent animals for forebrain samples, n=4 independent animals for midbrain samples and n=6 independent animals for hindbrain samples; also refer to Supplementary Data 1) clustered into 63 cell types. Progenitor cell types highlighted. c. t-SNE plot with cell clusters labeled with inferred anatomical regional location. FGP, fluorescent granular perithelial cells. Hind, hindbrain. Hyp, hypothalamus/preoptic area. Mid, midbrain. Thal, thalamus. Torus Long, torus longitudinalis. Vent. Fore., ventral forebrain. Cells of unknown origin or broad distribution are colored in grey. d. Iterative clustering of cells from the hindbrain/cerebellum are shown as an example. Inset highlights these eight clusters within initial t-SNE plot. Main panel, t-SNE plot of the resulting subclusters. Subclusters colored light grey either did not partition further or had no clear markers. Also refer to Supplementary Fig. 4 and Supplementary Data 4 for additional analysis. e. Dotplot of gene expression patterns of select marker genes (columns) for each subcluster (rows) from the hindbrain/cerebellum (n=8,330 cells) are shown as an example. Dot size represents the percentage of cells expressing the marker; color represents the average scaled expression level. Initial cluster numbers are indicated to the left of the subcluster (s) number. Clusters colored blue were subdivided by iterative analysis. f. Heat map of scaled gene expression of representative marker genes across cells within eight neural progenitor clusters. Original cluster numbers are indicated on the bottom. Marker genes are categorized according to the cell types they label (pink text). Inset highlights these eight clusters within initial t-SNE plot. g. Gene expression patterns of novel cell type markers. Cells within each t-SNE plot (n=58,492 cells) are colored by marker gene expression level (grey is low, red is high). Dotted boxes highlight clusters where markers are enriched.
Figure 3
Figure 3. An inducible CRISPR-Cas9 system for late barcode editing
a. Zebrafish that express the GESTALT barcode as polyadenylated (pA) mRNA were crossed to zebrafish that express heat shock-inducible Cas9 along with gRNAs 5–9. Resulting embryos were injected with Cas9 and gRNAs 1–4 at the one-cell stage (blue bars; early editing), and heat shocked at 30 hpf to induce transgenic Cas9 for a second round of editing (yellow bars; late editing). b. Mutations within the nine CRISPR target sites of the GESTALT barcode for three editing conditions (2 animals per condition). Red lines represent deletions, blue lines represent insertions. c. Pairwise comparisons using cosine dissimilarity of early and late edit patterns from eight doubly-edited embryos. d. Edit type at each target site within the barcode from all eight doubly-edited embryos. e. Chord diagram of the nature and frequency of deletions within and between target sites. Each colored sector represents a target site. Links between target sites represent inter-site deletions; self-links represent intra-site deletions. Link widths are proportional to the edit frequencies. f. Heat map of the frequency (log10 scale) of inter-site and intra-site deletions within and across the barcode target sites. g. Cumulative frequency of each barcode across all cells pooled from 8 embryos, considering only early barcode edits (blue), only late barcode edits (yellow) and full barcodes (grey).
Figure 4
Figure 4. A lineage tree of a zebrafish brain generated using scGESTALT
An example of a reconstructed lineage tree from a single juvenile zebrafish brain. 376 barcodes recovered from ZF3 using scRNAseq were assembled into a cell lineage tree based on shared edits using a maximum parsimony approach. Black nodes indicate early barcode edits; red nodes indicate late edits. Dashed lines connect individual cells to nodes on the tree. Cell types (identified from simultaneous transcriptome capture) are color coded as indicated in the legend. The barcode for each cell is displayed as a white bar with deletions (red) and insertions (blue). Tree depth is higher for the early editing events (maximum of 4 tiers), while late editing events generate a maximum of two tiers. A larger lineage tree obtained for ZF1 is shown as Supplementary Fig. 7. Interactive trees and the very large lineage tree for ZF2 can be found at: http://krishna.gs.washington.edu/content/members/aaron/fate_map/harvard_temp_trees/
Figure 5
Figure 5. Lineage relationships of cell types in the juvenile zebrafish brain
a. Barcodes are enriched within regions of the brain. Heat map of the distribution of ZF1 barcodes (rows, clone size >= 4 cells, n=27 barcodes, 524 cells) for each region of the brain (columns). Cell types were classified as belonging to the forebrain, midbrain or hindbrain, and the proportions of cells within each region were calculated for each barcode. Region proportions were scaled by row and colored as shown in the legend. b. Mini tree showing lineage branches and cluster contributions from clade a within brain ZF1. Black nodes indicate early edits; Red nodes, late edits. Each square represents a cell colored by cell type. Right, t-SNE plots with highlighted cell types: Yellow/brown (forebrain), blue (midbrain), green (hindbrain). Asterisk, progenitor cell types. Double asterisk, ependymal cells. Grey lines, additional branches of the tree. c. Lineage biases within the hypothalamus/preoptic area. Heat map of the distribution of ZF1 (6 barcodes, 95 cells) and ZF2 barcodes (8 barcodes, 113 cells) across indicated cell types within the hypothalamus/preoptic area, plotted as above. Insufficient recovery of barcodes from these cell types in ZF3 precluded analysis. d. Bar plots showing the distribution of descendant cells from two ZF1 barcodes into cell types of the hypothalamus/preoptic area. e. Mini tree showing ZF1 clade b descendants. Subclade c1 was marked during the early round of editing. Clones A, B, C and D were marked during the late round. Clone E was not edited in the late round. The mini tree highlights branches where cluster 20 cells (D) separated from clusters 27 and 30 cells (C) during late barcode editing. Right, t-SNE plots showing barcode distributions across cell types.
Figure 6
Figure 6. Barcodes shared between progenitor and differentiated cell types
a. Left, t-SNE plot showing clustering of neural progenitors and oligodendrocyte cell types only. Inset highlights these clusters within the initial t-SNE plot from Fig. 2. Right, progenitor cells from the largest barcode clone in two animals ZF1 (blue) and ZF2 (pink) are displayed on the t-SNE plot. These clones were characterized by cells of multiple stem/progenitor cell types. b. Trajectory of cerebellar granule cell differentiation generated with Monocle 2. Cells are colored by pseudotime. Inset highlights these clusters within the initial t-SNE plot. c. Cells along the trajectory are colored by cluster: 19 (progenitor); 6 and 26 (differentiated). The distribution of several cells containing one of three different scGESTALT barcodes from ZF1 (red square, red triangle) and ZF2 (black circle) are shown as examples to highlight barcodes found along the trajectory. d. Heat map of gene expression changes of selected markers during granule cell differentiation. Rows are marker genes, columns are single cells arranged in pseudotime, representative transcription factors colored in blue.

Comment in

  • Tracing cell-lineage histories.
    Burgess DJ. Burgess DJ. Nat Rev Genet. 2018 Jun;19(6):327. doi: 10.1038/s41576-018-0015-0. Nat Rev Genet. 2018. PMID: 29713013 No abstract available.

References

    1. Wagner A, Regev A, Yosef N. Revealing the vectors of cellular identity with single-cell genomics. Nat Biotechnol. 2016;34:1145–1160. - PMC - PubMed
    1. Poulin JF, Tasic B, Hjerling-Leffler J, Trimarchi JM, Awatramani R. Disentangling neural cell diversity using single-cell transcriptomics. Nat Neurosci. 2016;19:1131–1141. - PubMed
    1. Yuan GC, et al. Challenges and emerging directions in single-cell analysis. Genome Biology. 2017;18:84. - PMC - PubMed
    1. Klein AM, et al. Droplet barcoding for single-cell transcriptomics applied to embryonic stem cells. Cell. 2015;161:1187–1201. - PMC - PubMed
    1. Macosko EZ, et al. Highly Parallel Genome-wide Expression Profiling of Individual Cells Using Nanoliter Droplets. Cell. 2015;161:1202–1214. - PMC - PubMed

Publication types