. 2018 May 4;46(8):3852-3863.
doi: 10.1093/nar/gky228.

FoldX accurate structural protein-DNA binding prediction using PADA1 (Protein Assisted DNA Assembly 1)

Affiliations

FoldX accurate structural protein-DNA binding prediction using PADA1 (Protein Assisted DNA Assembly 1)

Javier Delgado Blanco et al. Nucleic Acids Res. .

Abstract

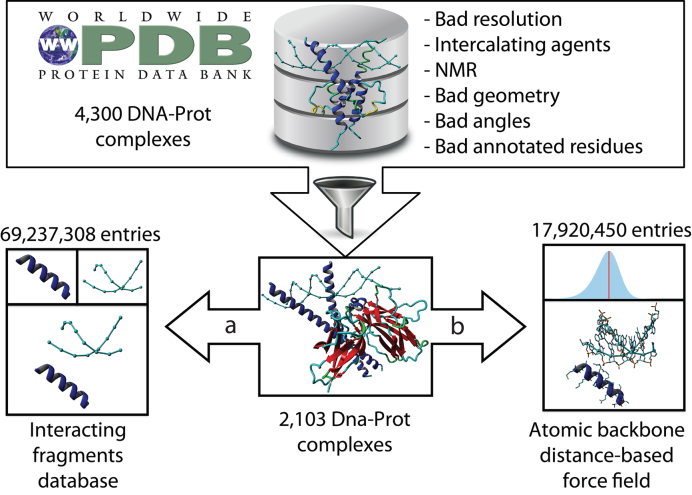
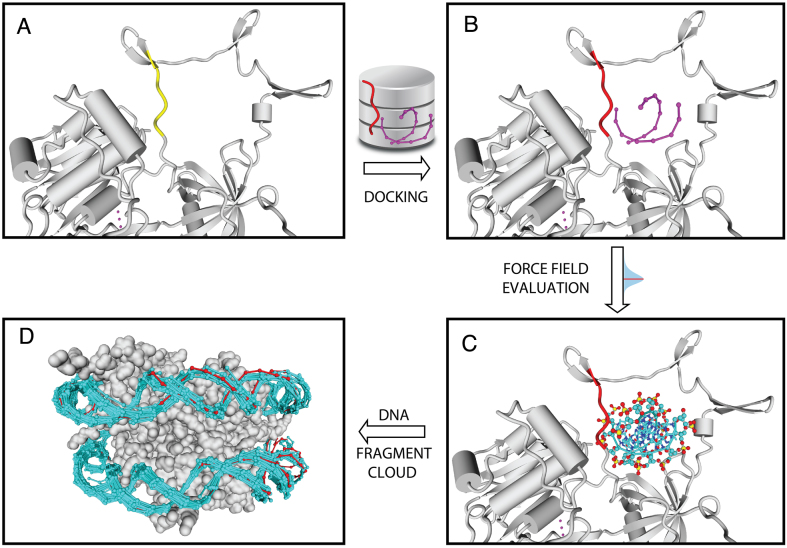
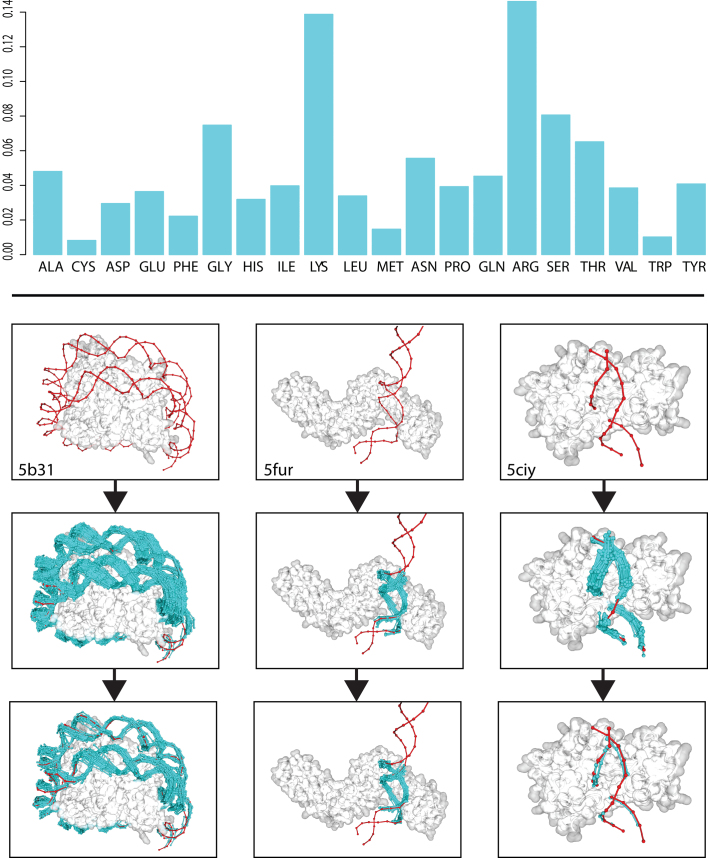
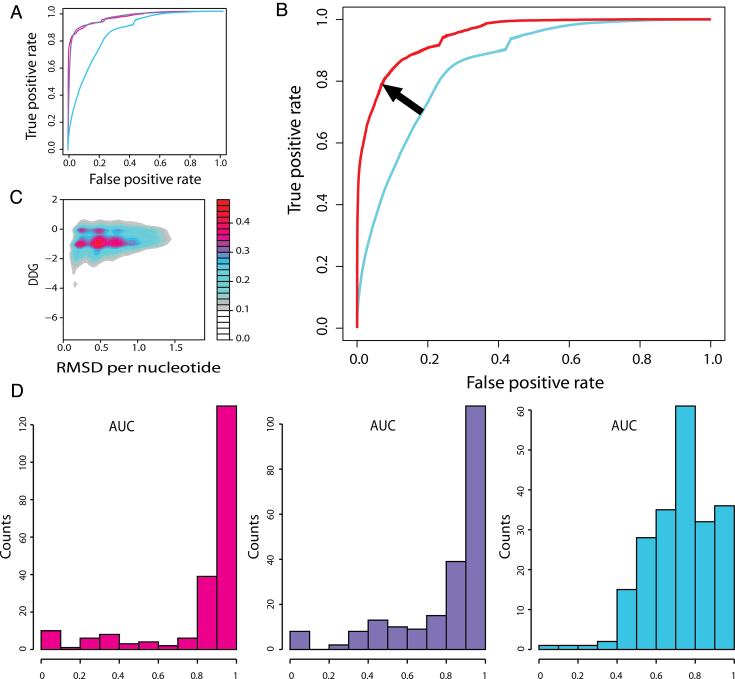
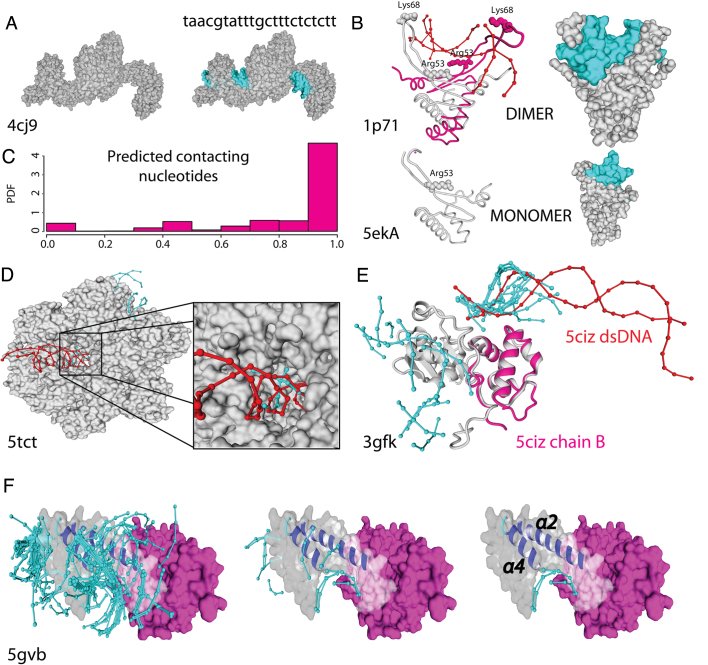
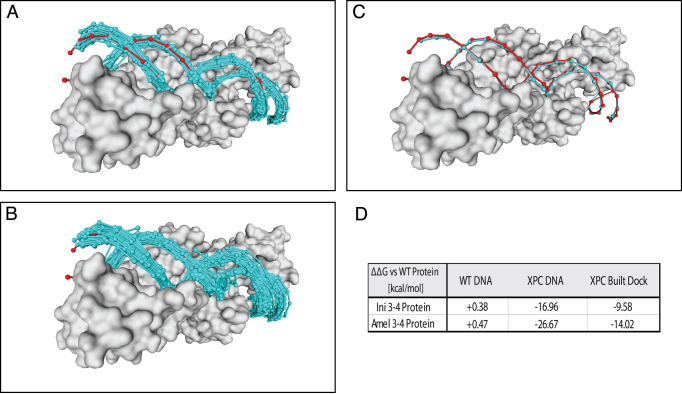
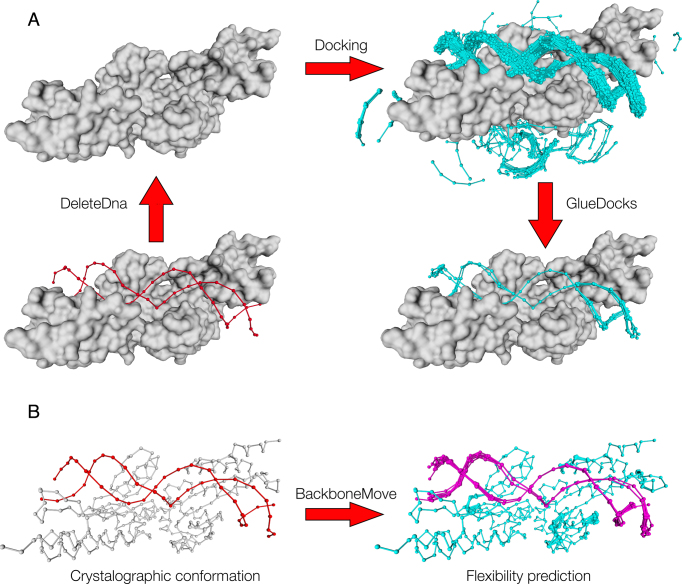
The speed at which new genomes are being sequenced highlights the need for genome-wide methods capable of predicting protein-DNA interactions. Here, we present PADA1, a generic algorithm that accurately models structural complexes and predicts the DNA-binding regions of resolved protein structures. PADA1 relies on a library of protein and double-stranded DNA fragment pairs obtained from a training set of 2103 DNA-protein complexes. It includes a fast statistical force field computed from atom-atom distances, to evaluate and filter the 3D docking models. Using published benchmark validation sets and 212 DNA-protein structures published after 2016 we predicted the DNA-binding regions with an RMSD of <1.8 Å per residue in >95% of the cases. We show that the quality of the docked templates is compatible with FoldX protein design tool suite to identify the crystallized DNA molecule sequence as the most energetically favorable in 80% of the cases. We highlighted the biological potential of PADA1 by reconstituting DNA and protein conformational changes upon protein mutagenesis of a meganuclease and its variants, and by predicting DNA-binding regions and nucleotide sequences in proteins crystallized without DNA. These results opens up new perspectives for the engineering of DNA-protein interfaces.


Figures

Figure 1.
Figure 1.
Database and force field genesis: (A) Digestion of complexes into peptide–dsDNA (pepX–dnaX) fragment pairs as database records (intXs); Poor quality structures (ie NMR, bad resolution) are filtered in this step. (B) Atomic distance measurement and force field generation.
Figure 2.
Figure 2.
Docking procedure: (A) a protein fragment (yellow) is used to query the pepX database for a compatible fragment; (B) the retrieved pepX fragment (red) is superimposed on the yellow one placing the associated DNA fragment (dnaX, purple); (C) backbone dnaX atoms are evaluated with the PADA1 force field; (D) an example with a histone octamer showing all dnaX docked models (cyan) fully covering the crystallographic DNA (red).
Figure 3.
Figure 3.
(Upper) DNA-amino acid binding propensities for all residues against any given nucleotide on the ModelXDB. (Lower) Examples (PDBs: 5b31, 5fur, 5ciy, top panel) of PADA1 predictions: fragment clouds (cyan) are filtered using the PADA1 force field going from a disperse cloud (medium panel) to a refined cluster (bottom panel) containing the most energetically favorable docks. Crystallographic DNA in red.
Figure 4.
Figure 4.
Density maps and roc curves: (A) ROC curves for all predicted 4 base pair length dnaX fragments against the 212 validation complexes considering an RMSD threshold per residue <1.8 Å allowing 1 (pink), 2 (purple), 3 (cyan) sequence mismatches in the search; (B) ROC curves for three mismatches before (cyan) and after (red) filtering results by contacts and energy; (C) ROC space density map, X-axis represents RMSD per residue and Y-axis binding energy for 1 mismatch predictions; (D) histogram with the frequency of cases for a given area under the curve or TP/FN rate for 1 (pink), 2 (purple), and 3 (blue) mismatches.
Figure 5.
Figure 5.
Accuracy on the docking predictions: In all cases cyan colour is used for docked DNA and red for the crystallographic one. (A) TAL effector (PDB: 4jc9), protein–DNA interface regions and nucleotide sequence specificity are correctly predicted. (B) Left and right: Cartoon and VdW surface style for a dimeric structure with DNA (PDB: 1p71; Upper) and the related protein crystallized as a monomer missing part of the structure (PDB: 5eka; lower). Predicted docked DNA in both structures in cyan. (C) histogram of sequence specificity accuracy over 13 proteins of different PFam family. (D) Humanized yeast ACC carboxyltransferase (PDB: 5tct) binding region (zoomed) was found within the five best energy docks. (E) the DNA-directed RNA polymerase subunit alpha of Bacillus subtilis (PDB: 3gfk, grey) superimposed to the overlapping domain of the E. coli ortholog with low sequence identity (PDB: 5ciz chainB, magenta). (F) The helical bundle of AND-1 human protein (PDB: 5gvb) present a dense cloud of docked fragments (left side) in the binding groove formed by the α2 and α4 helices. Within the six best energy docks for AND-1 human protein we found three docks (right side) placed within the predicted binding region.
Figure 6.
Figure 6.
I-Crel Amel3-4 (PDB: 4aqu) engineered protein: (A) DNA Docked molecules obtained using PADA1 default parameters in blue, XPC DNA in red. (B) Dockings obtained with relaxed parameters (dubiety = 0.5, cb-angle = 8°). (C) The merged DNA fragment using RMSD criteria against XPC DNA superimposed on the crystallographic DNA. (D) Energy variation for both Ini3-4 and Amel3-4 engineered proteins against the different DNAs. The built models show the same specificity tendencies experimentally reported for crystallographic DNAs (WT and XPC), and the PADA1 built dock shows that the full in-silico analysis reproduces the experimental affinity tendencies studied.
Figure 7.
Figure 7.
Modeling of flexibility upon binding. (A) DNA flexibility prediction: We first remove the Crystallographic DNA, then we do DNA Docking and select the fragments that will be used for reconstructing the DNA molecule. Once the fragments are selected we join those that are compatible using (GlueDocks; see Materials and Methods). As can be seen the cleavage site is quite rigid, while the DNA backbone becomes more flexible farther away from it. This flexibility could be used to design protein mutants that will recognize other DNA sequences. (B) Protein flexibility prediction: the BackboneMove command can be used to model protein backbone variability over the high free energy regions generated upon DNA flexibility prediction.

References

    1. Walter M.C., Rattei T., Arnold R., Güldener U., Münsterkötter M., Nenova K., Kastenmüller G., Tischler P., Wölling A., Volz A. et al. PEDANT covers all complete RefSeq genomes. Nucleic Acids Res. 2009; 37:D408–D411. - PMC - PubMed
    1. Luscombe N.M., Austin S.E., Berman H.M., Thornton J.M.. An overview of the structures of protein–DNA complexes. Genome Biol. 2000; 1:REVIEWS001. - PMC - PubMed
    1. Berman H.M., Westbrook J., Feng Z., Gilliland G., Bhat T.N., Weissig H., Shindyalov I.N., Bourne P.E.. The Protein Data Bank. Nucleic Acids Res. 2000; 28:235–242. - PMC - PubMed
    1. Stormo G.D. DNA binding sites: representation and discovery. Bioinformatics. 2000; 16:16–23. - PubMed
    1. Hwang S., Gou Z., Kuznetsov I.B.. DP-Bind: a web server for sequence-based prediction of DNA-binding residues in DNA-binding proteins. Bioinformatics. 2007; 23:634–636. - PubMed

Publication types