

GC Content of Early Metazoan Genes and Its Impact on Gene Expression Levels in Mammalian Cell Lines
- PMID: 29608715
- PMCID: PMC5952964
- DOI: 10.1093/gbe/evy040
GC Content of Early Metazoan Genes and Its Impact on Gene Expression Levels in Mammalian Cell Lines
Abstract
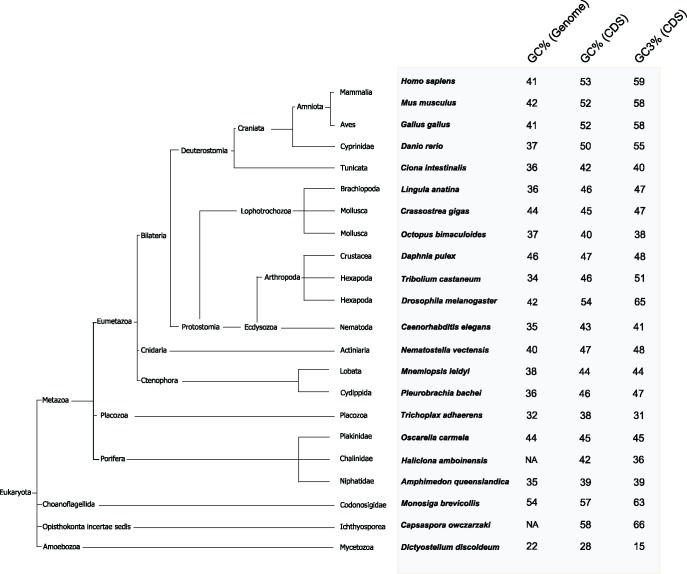
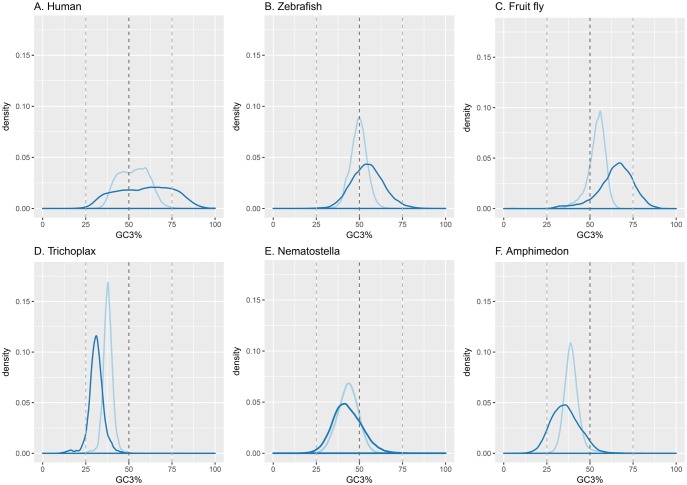
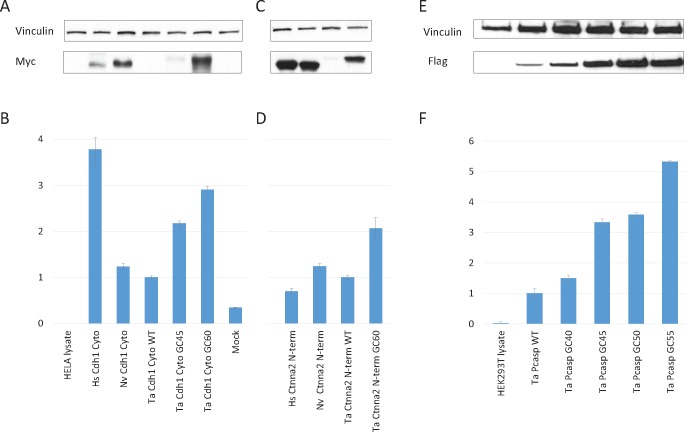
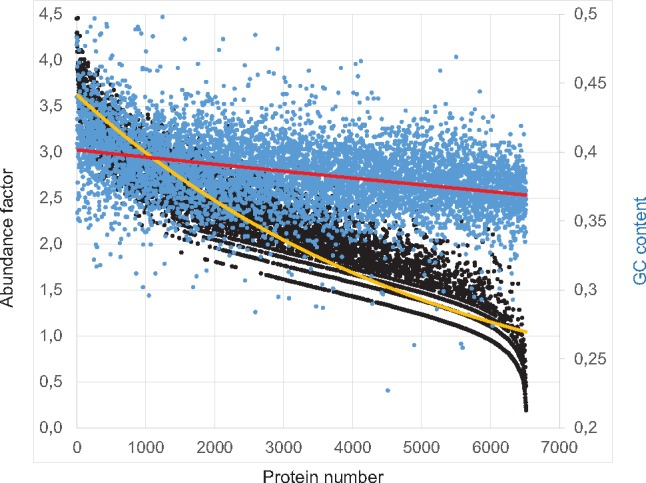
With the genomes available for many animal clades, including the early-branching metazoans, one can readily study the functional conservation of genes across a diversity of animal lineages. Ectopic expression of an animal protein in, for instance, a mammalian cell line is a generally used strategy in structure-function analysis. However, this might turn out to be problematic in case of distantly related species. Here we analyzed the GC content of the coding sequences of basal animals and show its impact on gene expression levels in human cell lines, and, importantly, how this expression efficiency can be improved. Optimization of the GC3 content in the coding sequences of cadherin, alpha-catenin, and paracaspase of Trichoplax adhaerens dramatically increased the expression of these basal animal genes in human cell lines.
Figures
Similar articles
-
The decline of isochores in mammals: an assessment of the GC content variation along the mammalian phylogeny.J Mol Evol. 2004 Jun;58(6):653-60. doi: 10.1007/s00239-004-2587-x. J Mol Evol. 2004. PMID: 15461422
-
Multiple dicer genes in the early-diverging metazoa.Mol Biol Evol. 2009 Jun;26(6):1333-40. doi: 10.1093/molbev/msp042. Epub 2009 Mar 10. Mol Biol Evol. 2009. PMID: 19276153
-
Expression pattern of the homeobox gene Not in the basal metazoan Trichoplax adhaerens.Gene Expr Patterns. 2004 Jul;4(4):443-7. doi: 10.1016/j.modgep.2004.01.002. Gene Expr Patterns. 2004. PMID: 15183311
-
Mammalian evolution and biomedicine: new views from phylogeny.Biol Rev Camb Philos Soc. 2007 Aug;82(3):375-92. doi: 10.1111/j.1469-185X.2007.00016.x. Biol Rev Camb Philos Soc. 2007. PMID: 17624960 Review.
-
Biased gene conversion and the evolution of mammalian genomic landscapes.Annu Rev Genomics Hum Genet. 2009;10:285-311. doi: 10.1146/annurev-genom-082908-150001. Annu Rev Genomics Hum Genet. 2009. PMID: 19630562 Review.
Cited by
-
Ancient Origin of the CARD-Coiled Coil/Bcl10/MALT1-Like Paracaspase Signaling Complex Indicates Unknown Critical Functions.Front Immunol. 2018 May 24;9:1136. doi: 10.3389/fimmu.2018.01136. eCollection 2018. Front Immunol. 2018. PMID: 29881386 Free PMC article.
-
Transcriptome of Sphaerospora molnari (Cnidaria, Myxosporea) blood stages provides proteolytic arsenal as potential therapeutic targets against sphaerosporosis in common carp.BMC Genomics. 2020 Jun 16;21(1):404. doi: 10.1186/s12864-020-6705-y. BMC Genomics. 2020. PMID: 32546190 Free PMC article.
-
Physicochemical Foundations of Life that Direct Evolution: Chance and Natural Selection are not Evolutionary Driving Forces.Life (Basel). 2020 Jan 21;10(2):7. doi: 10.3390/life10020007. Life (Basel). 2020. PMID: 31973071 Free PMC article.
-
Characterizing the interplay between gene nucleotide composition bias and splicing.Genome Biol. 2019 Nov 29;20(1):259. doi: 10.1186/s13059-019-1869-y. Genome Biol. 2019. PMID: 31783898 Free PMC article.
References
-
- Alvarez-Valin F, Lamolle G, Bernardi G.. 2002. Isochores, GC3 and mutation biases in the human genome. Gene 300(1–2):161–168. - PubMed
-
- Bernardi G. 1995. The human genome: organization and evolutionary history. Annu Rev Genet. 29:445–476. - PubMed
-
- Bernardi G. 2001. Misunderstandings about isochores. Part 1. Gene 276(1–2):3–13. - PubMed
-
- Chamary JV, Parmley JL, Hurst LD.. 2006. Hearing silence: non-neutral evolution at synonymous sites in mammals. Nat Rev Genet. 7(2):98–108. - PubMed
Publication types
MeSH terms
Substances
LinkOut - more resources
Full Text Sources
Other Literature Sources
Miscellaneous
