

Divergent Evolutionary Trajectories of Two Young, Homomorphic, and Closely Related Sex Chromosome Systems
- PMID: 29608717
- PMCID: PMC5841384
- DOI: 10.1093/gbe/evy045
Divergent Evolutionary Trajectories of Two Young, Homomorphic, and Closely Related Sex Chromosome Systems
Abstract
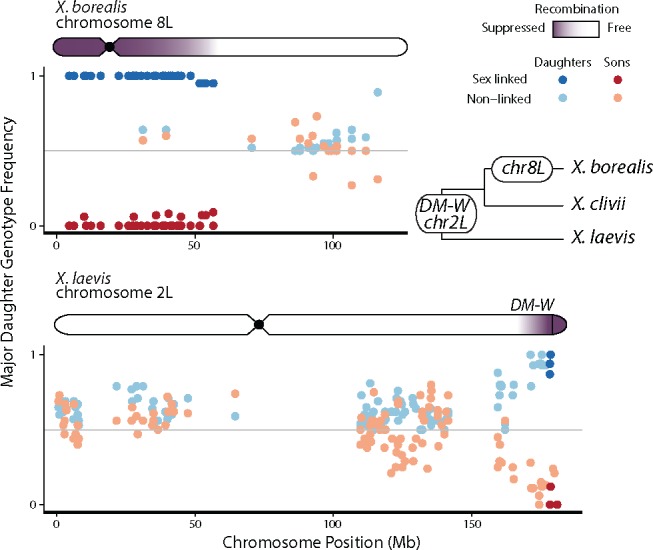
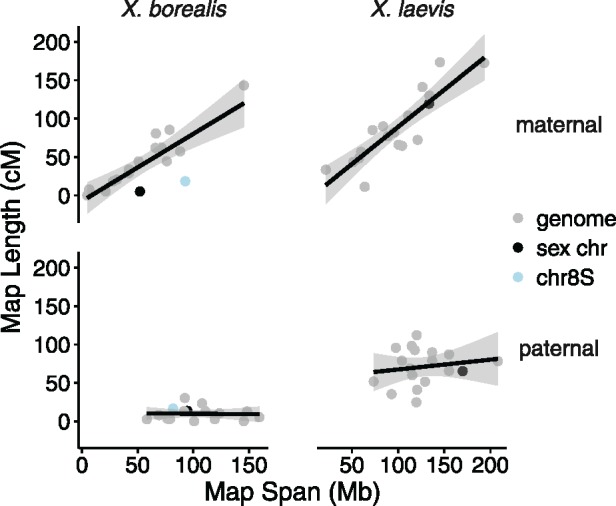
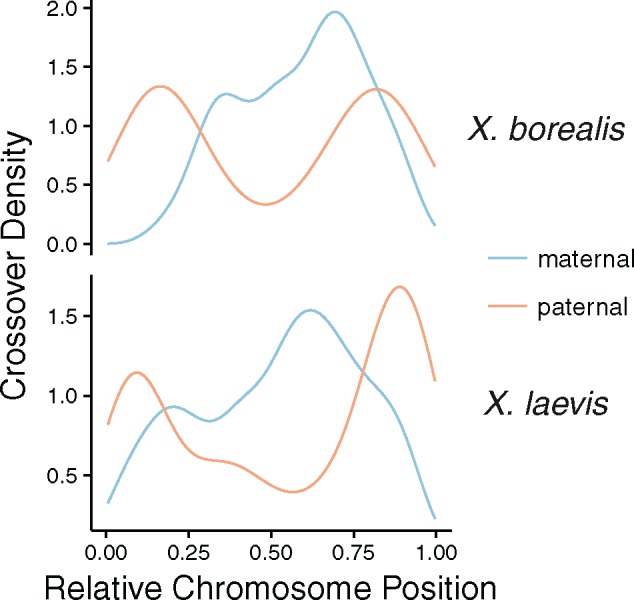
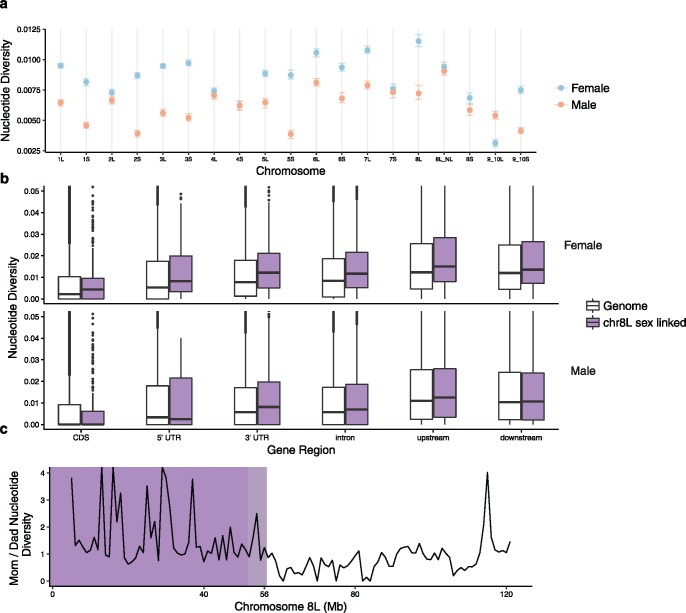
There exists extraordinary variation among species in the degree and nature of sex chromosome divergence. However, much of our knowledge about sex chromosomes is based on comparisons between deeply diverged species with different ancestral sex chromosomes, making it difficult to establish how fast and why sex chromosomes acquire variable levels of divergence. To address this problem, we studied sex chromosome evolution in two species of African clawed frog (Xenopus), both of whom acquired novel systems for sex determination from a recent common ancestor, and both of whom have female (ZW/ZZ) heterogamy. Derived sex chromosomes of one species, X. laevis, have a small region of suppressed recombination that surrounds the sex determining locus, and have remained this way for millions of years. In the other species, X. borealis, a younger sex chromosome system exists on a different pair of chromosomes, but the region of suppressed recombination surrounding an unidentified sex determining gene is vast, spanning almost half of the sex chromosomes. Differences between these sex chromosome systems are also apparent in the extent of nucleotide divergence between the sex chromosomes carried by females. Our analyses also indicate that in autosomes of both of these species, recombination during oogenesis occurs more frequently and in different genomic locations than during spermatogenesis. These results demonstrate that new sex chromosomes can assume radically different evolutionary trajectories, with far-reaching genomic consequences. They also suggest that in some instances the origin of new triggers for sex determination may be coupled with rapid evolution sex chromosomes, including recombination suppression of large genomic regions.
Figures
Similar articles
-
Sex chromosome degeneration, turnover, and sex-biased expression of sex-linked transcripts in African clawed frogs (Xenopus).Philos Trans R Soc Lond B Biol Sci. 2021 Aug 30;376(1832):20200095. doi: 10.1098/rstb.2020.0095. Epub 2021 Jul 12. Philos Trans R Soc Lond B Biol Sci. 2021. PMID: 34247503 Free PMC article.
-
Sex chromosome differentiation and the W- and Z-specific loci in Xenopus laevis.Dev Biol. 2017 Jun 15;426(2):393-400. doi: 10.1016/j.ydbio.2016.06.015. Epub 2016 Jun 11. Dev Biol. 2017. PMID: 27297884
-
A frog with three sex chromosomes that co-mingle together in nature: Xenopus tropicalis has a degenerate W and a Y that evolved from a Z chromosome.PLoS Genet. 2020 Nov 9;16(11):e1009121. doi: 10.1371/journal.pgen.1009121. eCollection 2020 Nov. PLoS Genet. 2020. PMID: 33166278 Free PMC article.
-
The Diversity and Evolution of Sex Chromosomes in Frogs.Genes (Basel). 2021 Mar 26;12(4):483. doi: 10.3390/genes12040483. Genes (Basel). 2021. PMID: 33810524 Free PMC article. Review.
-
A ZZ/ZW-type sex determination in Xenopus laevis.FEBS J. 2011 Apr;278(7):1020-6. doi: 10.1111/j.1742-4658.2011.08031.x. Epub 2011 Feb 25. FEBS J. 2011. PMID: 21281450 Review.
Cited by
-
Testis Development and Differentiation in Amphibians.Genes (Basel). 2021 Apr 16;12(4):578. doi: 10.3390/genes12040578. Genes (Basel). 2021. PMID: 33923451 Free PMC article. Review.
-
Sex chromosomes in meiotic, hemiclonal, clonal and polyploid hybrid vertebrates: along the 'extended speciation continuum'.Philos Trans R Soc Lond B Biol Sci. 2021 Sep 13;376(1833):20200103. doi: 10.1098/rstb.2020.0103. Epub 2021 Jul 26. Philos Trans R Soc Lond B Biol Sci. 2021. PMID: 34304588 Free PMC article. Review.
-
Sex chromosome degeneration, turnover, and sex-biased expression of sex-linked transcripts in African clawed frogs (Xenopus).Philos Trans R Soc Lond B Biol Sci. 2021 Aug 30;376(1832):20200095. doi: 10.1098/rstb.2020.0095. Epub 2021 Jul 12. Philos Trans R Soc Lond B Biol Sci. 2021. PMID: 34247503 Free PMC article.
-
Rapid Sex Chromosome Turnover in African Clawed Frogs (Xenopus) and the Origins of New Sex Chromosomes.Mol Biol Evol. 2024 Dec 5;41(12):msae234. doi: 10.1093/molbev/msae234. Mol Biol Evol. 2024. PMID: 39665151 Free PMC article.
-
Analysis of Sex Chromosome Evolution in the Clade Palaeognathae from Phased Genome Assembly.Genome Biol Evol. 2021 Nov 5;13(11):evab242. doi: 10.1093/gbe/evab242. Genome Biol Evol. 2021. PMID: 34718546 Free PMC article.
References
-
- Bachtrog D, Charlesworth B.. 2002. Reduced adaptation of a non-recombining neo-y chromosome. Nature 416(6878):323–326. - PubMed
Publication types
MeSH terms
LinkOut - more resources
Full Text Sources
Other Literature Sources
