

Signatures of Long-Term Balancing Selection in Human Genomes
- PMID: 29608730
- PMCID: PMC5952967
- DOI: 10.1093/gbe/evy054
Signatures of Long-Term Balancing Selection in Human Genomes
Abstract
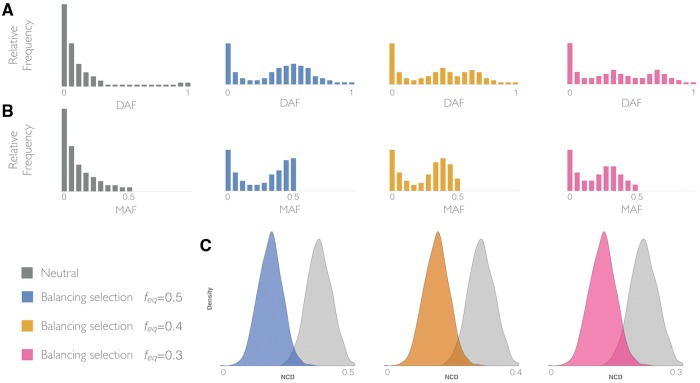
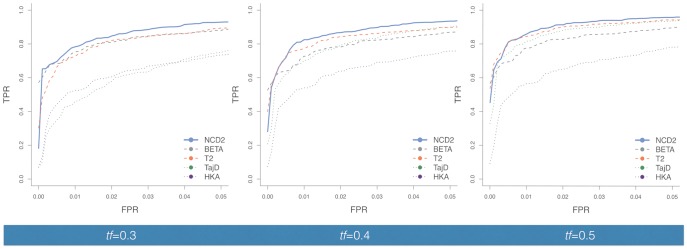
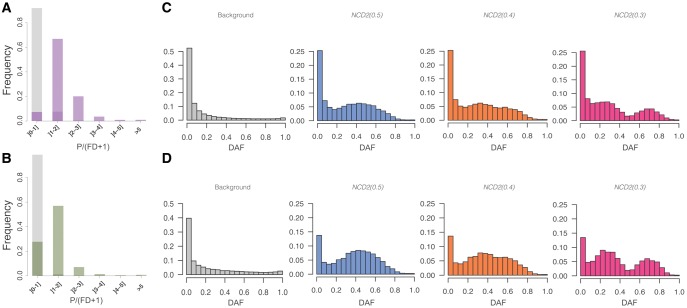
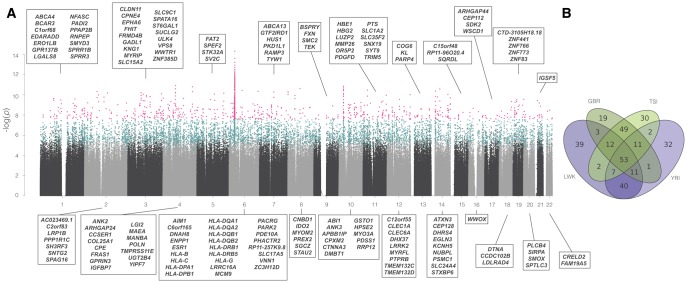
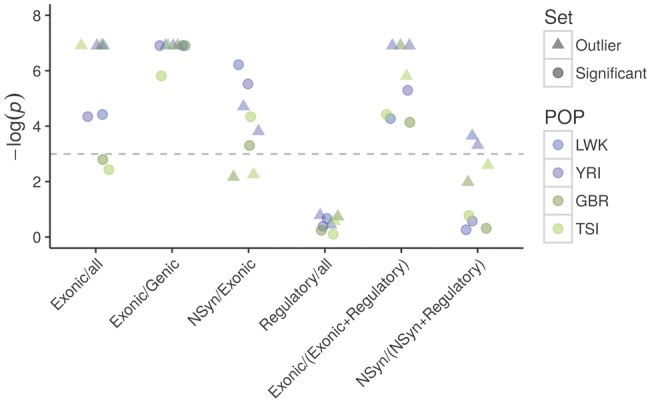
Balancing selection maintains advantageous diversity in populations through various mechanisms. Although extensively explored from a theoretical perspective, an empirical understanding of its prevalence and targets lags behind our knowledge of positive selection. Here, we describe the Non-central Deviation (NCD), a simple yet powerful statistic to detect long-term balancing selection (LTBS) that quantifies how close frequencies are to expectations under LTBS, and provides the basis for a neutrality test. NCD can be applied to a single locus or genomic data, and can be implemented considering only polymorphisms (NCD1) or also considering fixed differences with respect to an outgroup (NCD2) species. Incorporating fixed differences improves power, and NCD2 has higher power to detect LTBS in humans under different frequencies of the balanced allele(s) than other available methods. Applied to genome-wide data from African and European human populations, in both cases using chimpanzee as an outgroup, NCD2 shows that, albeit not prevalent, LTBS affects a sizable portion of the genome: ∼0.6% of analyzed genomic windows and 0.8% of analyzed positions. Significant windows (P < 0.0001) contain 1.6% of SNPs in the genome, which disproportionally fall within exons and change protein sequence, but are not enriched in putatively regulatory sites. These windows overlap ∼8% of the protein-coding genes, and these have larger number of transcripts than expected by chance even after controlling for gene length. Our catalog includes known targets of LTBS but a majority of them (90%) are novel. As expected, immune-related genes are among those with the strongest signatures, although most candidates are involved in other biological functions, suggesting that LTBS potentially influences diverse human phenotypes.
Figures
Similar articles
-
Diverse functions associate with non-coding polymorphisms shared between humans and chimpanzees.BMC Ecol Evol. 2022 May 23;22(1):68. doi: 10.1186/s12862-022-02020-x. BMC Ecol Evol. 2022. PMID: 35606693 Free PMC article.
-
A whole genome long-range haplotype (WGLRH) test for detecting imprints of positive selection in human populations.Bioinformatics. 2006 Sep 1;22(17):2122-8. doi: 10.1093/bioinformatics/btl365. Epub 2006 Jul 15. Bioinformatics. 2006. PMID: 16845142
-
Balancing selection on a regulatory region exhibiting ancient variation that predates human-neandertal divergence.PLoS Genet. 2013 Apr;9(4):e1003404. doi: 10.1371/journal.pgen.1003404. Epub 2013 Apr 11. PLoS Genet. 2013. PMID: 23593015 Free PMC article.
-
The molecular signature of selection underlying human adaptations.Am J Phys Anthropol. 2006;Suppl 43:89-130. doi: 10.1002/ajpa.20518. Am J Phys Anthropol. 2006. PMID: 17103426 Review.
-
Understanding the recent evolution of the human genome: insights from human-chimpanzee genome comparisons.Hum Mutat. 2007 Feb;28(2):99-130. doi: 10.1002/humu.20420. Hum Mutat. 2007. PMID: 17024666 Review.
Cited by
-
Balancing Selection for Pathogen Resistance Reveals an Intercontinental Signature of Red Queen Coevolution.Mol Biol Evol. 2021 Oct 27;38(11):4918-4933. doi: 10.1093/molbev/msab217. Mol Biol Evol. 2021. PMID: 34289047 Free PMC article.
-
Balancing selection on an MYB transcription factor maintains the twig trichome color variation in Melastoma normale.BMC Biol. 2023 May 24;21(1):122. doi: 10.1186/s12915-023-01611-4. BMC Biol. 2023. PMID: 37226197 Free PMC article.
-
Common genetic associations between age-related diseases.Nat Aging. 2021 Apr;1(4):400-412. doi: 10.1038/s43587-021-00051-5. Epub 2021 Apr 8. Nat Aging. 2021. PMID: 33959723 Free PMC article.
-
Structural genomic variation and behavioral interactions underpin a balanced sexual mimicry polymorphism.Curr Biol. 2024 Oct 21;34(20):4662-4676.e9. doi: 10.1016/j.cub.2024.08.053. Epub 2024 Sep 25. Curr Biol. 2024. PMID: 39326413 Free PMC article.
-
Probabilistic Estimation of Identity by Descent Segment Endpoints and Detection of Recent Selection.Am J Hum Genet. 2020 Nov 5;107(5):895-910. doi: 10.1016/j.ajhg.2020.09.010. Epub 2020 Oct 13. Am J Hum Genet. 2020. PMID: 33053335 Free PMC article.
References
-
- Alonso S, Lopez S, Izagirre N, de la Rua C.. 2008. Overdominance in the human genome and olfactory receptor activity. Mol Biol Evol. 25(5):997–1001. - PubMed
-
- Andrés AM. 2011. Balancing selection in the human genome. In Encyclopedia of Life Sciences Wiley. eLS 1–8.
Publication types
MeSH terms
LinkOut - more resources
Full Text Sources
Other Literature Sources
Research Materials
